Company Overview:
A2 Milk Company Ltd (ASX: A2M) is involved in the distribution and sale of milk and dairy products. It operates through the following segments: Australia and New Zealand, China and Other Asia, and USA.
A2M’s Technical Analysis:
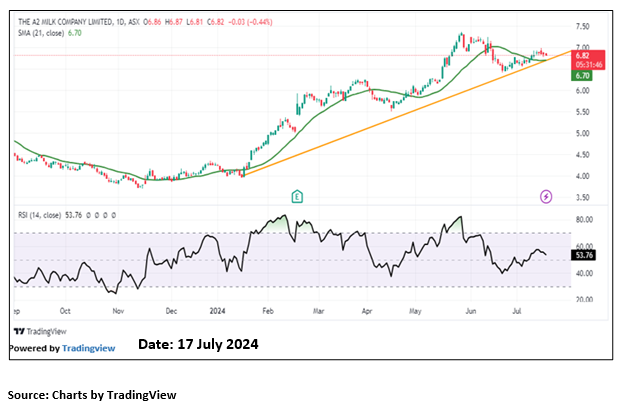
On the daily chart, A2M prices are rising above the horizontal trendline support zone and taking support from the same. Moreover, the momentum oscillator RSI (14-period) is showing a reading of ~53.76 level. Further, the prices are trading above the trend-following indicator 21-period SMA, which may act as support zone. An important support level for the stock is placed at AUD 6.00, while the key resistance level is placed at AUD 7.50.
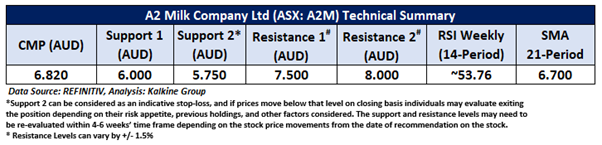

Considering the company’s current price taking the support from the trendline, and technical indicators analysis, a ‘Speculative Buy’ recommendation is given on the stock. The stock was analysed as per the current market price of AUD 6.82 as on 17 July 2024 at 10:31 AM AEST. A2 Milk Company Ltd (ASX: A2M) was last covered in a report dated ’18 January 2024.’
Daily Technical Chart –A2M
Markets are trading in a highly volatile zone currently due to certain macro-economic issues and geopolitical tensions prevailing. Therefore, it is prudent to follow a cautious approach while investing.
Note 1: Past performance is neither an Indicator nor a guarantee of future performance.
Note 2: Investment decision should be made depending on an individual’s appetite for upside potential, risks, and any previous holdings. This recommendation is purely based on technical analysis, and fundamental analysis has not been considered in this report.
Note 3: Related Risks: This report may be looked at from high-risk perspective and recommendations are provided are for a short duration. Recommendations provided in this report are solely based on technical parameters, and the fundamental performance of the stocks has not been considered in the decision-making process. Other factors which could impact the stock prices include market risks, regulatory risks, interest rates risks, currency risks, social and political instability risks etc.
Technical Indicators Defined: -
Support: A level at which the stock prices tend to find support if they are falling, and a downtrend may take a pause backed by demand or buying interest. Support 1 refers to the nearby support level for the stock and if the price breaches the level, then Support 2 may act as the crucial support level for the stock.
Resistance: A level at which the stock prices tend to find resistance when they are rising, and an uptrend may take a pause due to profit booking or selling interest. Resistance 1 refers to the nearby resistance level for the stock and if the price surpasses the level, then Resistance 2 may act as the crucial resistance level for the stock.
Stop-loss: It is a level to protect further losses in case of unfavourable movement in the stock prices.
The Green colour line reflects the 21-period moving average. SMA helps to identify existing price trends. If the prices are trading above the 21-period, prices are currently in a bullish trend (Vice – Versa).
The Blue colour line reflects the 50-period moving average. SMA helps to identify existing price trends. If the prices are trading above the 50-period, prices are currently in a bullish trend (Vice – Versa).
The Orange/ Yellow colour line represents the Trendline.
The Purple colour line in the chart’s lower segment reflects the Relative Strength Index (14-Period), which indicates price momentum and signals momentum in trend. A reading of 70 or above suggests overbought status, while a reading of 30 or below suggests an oversold status.

 Please wait processing your request...