Company Overview: 4DS Memory Limited (ASX:4DS) is a semiconductor technology company pioneering next-generation non-volatile memory. Its Interface Switching ReRAM technology is designed for advanced CMOS process nodes, delivering high bandwidth, low energy per bit, and tuneable persistence—key features for AI and compute-intensive applications. This Report covers the Price Action, Technical Indicators Analysis along with the Support Levels, Resistance Levels, and Recommendations on this stock.
Recent Updates:
The company is progressing toward commercialisation through a series of development milestones with imec, its nanoelectronics R&D partner. The manufacture of the Sixth Platform Lot—a 20nm memory cell array—marks a critical advancement. If validated, the company expects this scale-down from a 60nm array to establish its ReRAM as a generational memory technology.
To support its growth, 4DS completed a AUD 6mn placement and a AUD 2.6mn share purchase plan in Q1 2025. 4DS reported AUD 9.08mn in cash as of 31 March 2025.
In the first half of FY25, 4DS reported an 11.8% YoY jump in revenue to AUD 145,552 and widened losses by 94.4% YoY.
Strategically, 4DS entered into a Design Agreement with Infineon Technologies LLC in December 2024 to co-develop a custom ReRAM test chip. Infineon brings deep technical expertise and accelerates 4DS' path toward commercial readiness.
4DS’ Technical Analysis:
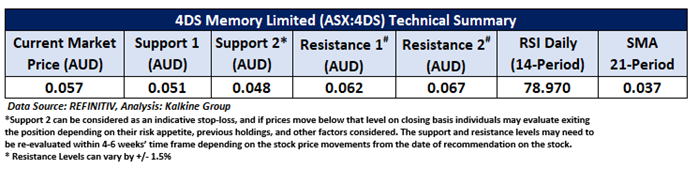
On the daily chart, 4DS is maintaining its position above key horizontal trendline support, signalling ongoing price stability and strength within the current uptrend. The 14-period Relative Strength Index (RSI) is elevated at 78.97, reflecting strong bullish momentum, though nearing overbought territory. The stock is also trading comfortably above its 50-day Simple Moving Average (SMA), which continues to act as dynamic with support for further confirmation of the prevailing positive trend. Key price levels to watch are support at AUD 0.051 and resistance at AUD 0.062.

Daily Technical Chart – 4DS
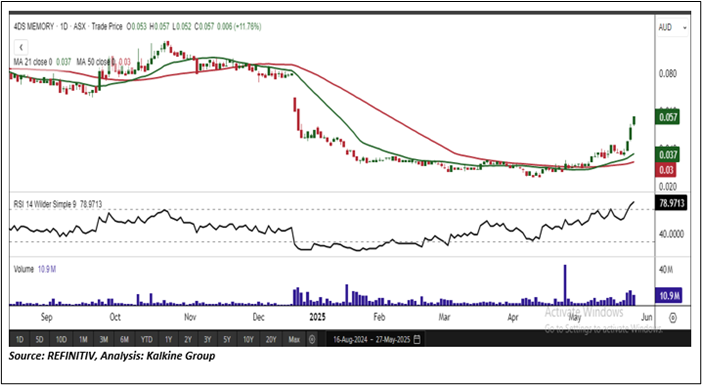
Considering the stock’s current prices are trading above the horizontal trendline support level, and momentum oscillator analysis, a “Speculative Buy” recommendation is given on the stock. The stock was analysed as per the current market price of AUD 0.057 per share as on 27 May 2025 at 2.20 PM AEST. 4DS Memory Limited (ASX:4DS) was last covered in a report dated ’01 December2023’.
Note 1: Past performance is neither an Indicator nor a guarantee of future performance.
Note 2: Investment decision should be made depending on an individual’s appetite for upside potential, risks, and any previous holdings. This recommendation is purely based on technical analysis, and fundamental analysis has not been considered in this report.
Note 3: Related Risks: This report may be looked at from high-risk perspective and recommendations are provided are for a short duration. Recommendations provided in this report are solely based on technical parameters, and the fundamental performance of the stocks has not been considered in the decision-making process. Other factors which could impact the stock prices include market risks, regulatory risks, interest rates risks, currency risks, social and political instability risks etc.
The reference date for all price data, currency, technical indicators, support, and resistance levels is May 27, 2025. The reference data in this report has been partly sourced from REFINITIV.
Technical Indicators Defined:
Support: A level at which the stock prices tend to find support if they are falling, and a downtrend may take a pause backed by demand or buying interest. Support 1 refers to the nearby support level for the stock and if the price breaches the level, then Support 2 may act as the crucial support level for the stock.
Resistance: A level at which the stock prices tend to find resistance when they are rising, and an uptrend may take a pause due to profit booking or selling interest. Resistance 1 refers to the nearby resistance level for the stock and if the price surpasses the level, then Resistance 2 may act as the crucial resistance level for the stock.
Stop-loss: It is a level to protect further losses in case of unfavourable movement in the stock prices.
The Green colour line reflects the 21-period moving average. SMA helps to identify existing price trends. If the prices are trading above the 21-period, prices are currently in a bullish trend (Vice – Versa).
The Blue colour line reflects the 50-period moving average. SMA helps to identify existing price trends. If the prices are trading above the 50-period, prices are currently in a bullish trend (Vice – Versa).
The Orange/ Yellow colour line represents the Trendline.
The Purple colour line in the chart’s lower segment reflects the Relative Strength Index (14-Period), which indicates price momentum and signals momentum in trend. A reading of 70 or above suggests overbought status, while a reading of 30 or below suggests an oversold status.

 Please wait processing your request...