Company Overview: EchoIQ Ltd (ASX: EIQ) is indeed an Australian-based company operating at the intersection of artificial intelligence and medical technology, specifically within the field of cardiology. The company leverages AI and its proprietary software to analyze cardiac data, with the goal of improving clinical decision-making. This Report covers the Price Action, Technical Indicators Analysis along with the Support Levels, Resistance Levels, and Recommendations on this stock.
EIQ’s Technical Analysis:
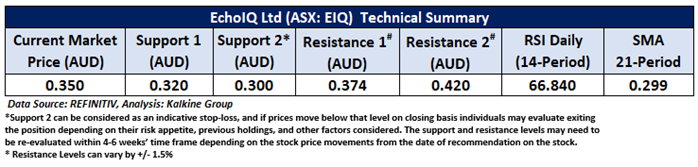
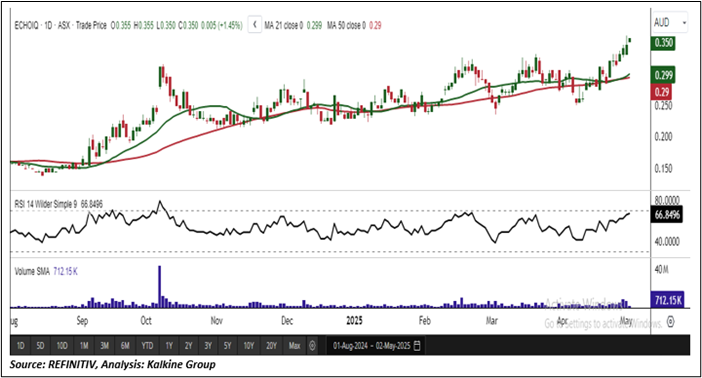
On the daily chart, EIQ is trading above a rising trendline support zone, signalling ongoing price stability and trend strength. The 14-period Relative Strength Index (RSI) is currently around 66.84, suggesting moderate bullish momentum without yet reaching overbought conditions. Additionally, the stock is positioned above the 50-day Simple Moving Average (SMA), which serves as a dynamic support level and further supports the prevailing upward trend. Key price levels to watch include a significant support at AUD 0.320 and a major resistance at AUD 0.374.

Daily Technical Chart – EIQ
Considering the stock’s current price levels are trading above the rising trendline support, and momentum oscillator analysis, a “Speculative Buy” recommendation is given on the stock. The stock was analysed as per the current market price of AUD 0.350 per share as on May 02, 2025, at 12:15 PM AEST, up by 1.45%.
Note 1: Past performance is neither an Indicator nor a guarantee of future performance.
Note 2: Investment decision should be made depending on an individual’s appetite for upside potential, risks, and any previous holdings. This recommendation is purely based on technical analysis, and fundamental analysis has not been considered in this report.
Note 3: Related Risks: This report may be looked at from high-risk perspective and recommendations are provided are for a short duration. Recommendations provided in this report are solely based on technical parameters, and the fundamental performance of the stocks has not been considered in the decision-making process. Other factors which could impact the stock prices include market risks, regulatory risks, interest rates risks, currency risks, social and political instability risks etc.
The reference date for all price data, currency, technical indicators, support, and resistance levels is May 02, 2025. The reference data in this report has been partly sourced from REFINITIV.
Technical Indicators Defined:
Support: A level at which the stock prices tend to find support if they are falling, and a downtrend may take a pause backed by demand or buying interest. Support 1 refers to the nearby support level for the stock and if the price breaches the level, then Support 2 may act as the crucial support level for the stock.
Resistance: A level at which the stock prices tend to find resistance when they are rising, and an uptrend may take a pause due to profit booking or selling interest. Resistance 1 refers to the nearby resistance level for the stock and if the price surpasses the level, then Resistance 2 may act as the crucial resistance level for the stock.
Stop-loss: It is a level to protect further losses in case of unfavourable movement in the stock prices.
The Green colour line reflects the 21-period moving average. SMA helps to identify existing price trends. If the prices are trading above the 21-period, prices are currently in a bullish trend (Vice – Versa).
The Blue colour line reflects the 50-period moving average. SMA helps to identify existing price trends. If the prices are trading above the 50-period, prices are currently in a bullish trend (Vice – Versa).
The Orange/ Yellow colour line represents the Trendline.
The Purple colour line in the chart’s lower segment reflects the Relative Strength Index (14-Period), which indicates price momentum and signals momentum in trend. A reading of 70 or above suggests overbought status, while a reading of 30 or below suggests an oversold status.

 Please wait processing your request...