Company Overview: White Cliff Minerals Limited (ASX: WCN) engages in the exploration of mineral properties in Australia and Canada. It explores for lithium, rare earth elements, gold, copper, silver, nickel, uranium, iron oxide, lead, and cobalt deposits. This Report covers the Price Action, Technical Indicators Analysis along with the Support Levels, Resistance Levels, and Recommendations on this stock.
Rae Copper Project Hits 90m @ 4% Cu from Surface: Assay results from White Cliff Minerals' Rae Copper Project continue to confirm continuity of shallow, high-grade copper mineralisation at the Danvers prospect. Drill hole DAN25005 returned a standout intercept of 90m @ 4% Cu and 7.5g/t Ag from surface, including 18m @ 6.5% Cu and 11.4g/t Ag from 26m, 1.52m @ 19.45% Cu and 34.1g/t Ag from 30m, and 14m @ 7.7% Cu and 16.2g/t Ag from 61m. The Company is fully funded for its 2025 drilling campaign, following a successful AUD 14.4M capital raise.
WCN Secures AUD 14.4M Capital Raise: White Cliff Minerals Limited (ASX: WCN) stated that it has secured firm commitments to raise approximately AUD 14.4 million (before costs) through the issue of 384,615,398 new fully paid ordinary shares. Under the Canadian "flow-through shares" tax provisions, the Company will issue 307,692,321 shares at AUD 0.0403 per share, raising approximately AUD 12.4 million. In addition, the company has received commitments to raise a further AUD 2 million (before costs) through a share placement to both new and existing sophisticated and professional investors.
WCN’s Technical Analysis:
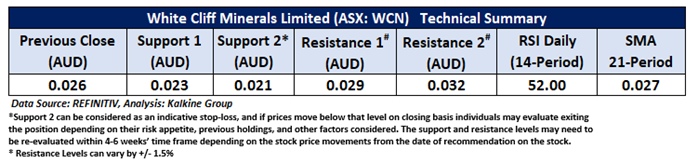
On the daily chart, WCN is holding above a falling trendline support zone, indicating a potential shift in momentum. The 14-period Relative Strength Index (RSI) stands at approximately 52.00, suggesting a neutral-to-bullish sentiment with increasing buying interest. Additionally, the stock is trading above the 50-period Simple Moving Average (SMA), a key trend-following indicator that now acts as dynamic support, reinforcing the current bullish bias. Key levels to monitor include strong support at AUD 0.023 and overhead resistance at AUD 0.029.

Daily Technical Chart – WCN
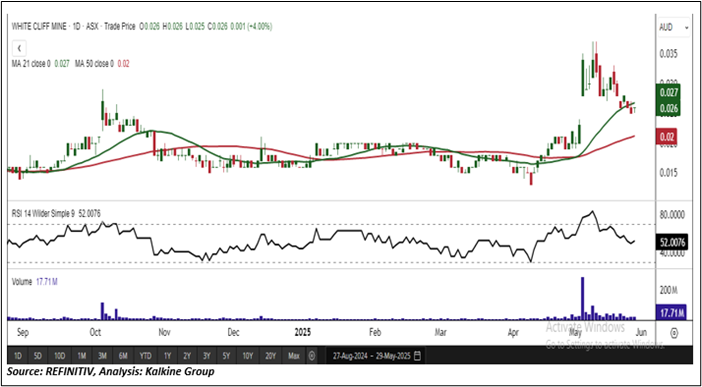
Considering the stock’s current price levels are trading above the falling trendline support zone, and momentum oscillator analysis, a “Speculative Buy” recommendation is given on the stock. The stock was analysed as per the closing price of AUD 0.026 per share as on 29 May 2025, up by 4.00%. White Cliff Minerals Limited (ASX: WCN) was last covered in a report dated ’06 November 2020’.
Note 1: Past performance is neither an Indicator nor a guarantee of future performance.
Note 2: Investment decision should be made depending on an individual’s appetite for upside potential, risks, and any previous holdings. This recommendation is purely based on technical analysis, and fundamental analysis has not been considered in this report.
Note 3: Related Risks: This report may be looked at from high-risk perspective and recommendations are provided are for a short duration. Recommendations provided in this report are solely based on technical parameters, and the fundamental performance of the stocks has not been considered in the decision-making process. Other factors which could impact the stock prices include market risks, regulatory risks, interest rates risks, currency risks, social and political instability risks etc.
The reference date for all price data, currency, technical indicators, support, and resistance levels is May 29, 2025. The reference data in this report has been partly sourced from REFINITIV.
Technical Indicators Defined:
Support: A level at which the stock prices tend to find support if they are falling, and a downtrend may take a pause backed by demand or buying interest. Support 1 refers to the nearby support level for the stock and if the price breaches the level, then Support 2 may act as the crucial support level for the stock.
Resistance: A level at which the stock prices tend to find resistance when they are rising, and an uptrend may take a pause due to profit booking or selling interest. Resistance 1 refers to the nearby resistance level for the stock and if the price surpasses the level, then Resistance 2 may act as the crucial resistance level for the stock.
Stop-loss: It is a level to protect further losses in case of unfavourable movement in the stock prices.
The Green colour line reflects the 21-period moving average. SMA helps to identify existing price trends. If the prices are trading above the 21-period, prices are currently in a bullish trend (Vice – Versa).
The Blue colour line reflects the 50-period moving average. SMA helps to identify existing price trends. If the prices are trading above the 50-period, prices are currently in a bullish trend (Vice – Versa).
The Orange/ Yellow colour line represents the Trendline.
The Purple colour line in the chart’s lower segment reflects the Relative Strength Index (14-Period), which indicates price momentum and signals momentum in trend. A reading of 70 or above suggests overbought status, while a reading of 30 or below suggests an oversold status.

 Please wait processing your request...