Company Overview: Warriedar Resources Limited (ASX: WA8) engages in the exploration and evaluation of mineral properties in the United States and Australia. It explores gold, copper, and base metal deposits. This Report covers the Price Action, Technical Indicators Analysis along with the Support Levels, Resistance Levels, and Recommendations on this stock.
Summary of the Ricciardo Project MRE Update (Amended)
On 5 May 2025, Warriedar Resources released an amended Mineral Resource Estimate (MRE) update for its Ricciardo Project within the Golden Range operation in Western Australia. The update details a significant increase in the mineral resources at Ricciardo, driven by successful drilling and exploration. Warriedar has achieved a 107% uplift in the total project resource, now standing at 1.96 million ounces of gold equivalent at an average grade of 2.5g/t, with the open-pit component comprising 11.4 million tonnes at 3.3g/t gold equivalent. This growth is underpinned by the identification of Australia’s largest open-pit antimony (Sb) resource, a critical mineral experiencing a global supply squeeze and dramatic price surge.
Key Highlights of Q3 FY25 (for the quarter ended 31 March 2025)
Operational Highlights:
Warriedar continued active exploration at its Golden Range and Fields Find projects in Western Australia.
The company focused on resource growth drilling at the Ricciardo deposit, with positive results supporting the recent Mineral Resource Estimate (MRE) upgrade.
Metallurgical test work and technical studies progressed, aimed at advancing project development and unlocking value from both gold and antimony resources.
The Group is well-funded to support growth-focused drilling at Golden Range in 2025, backed by a cash position of approximately AU$7.9 million as of 31 March 2025 and no debt (excluding standard trade payables).
WA8’s Technical Analysis:
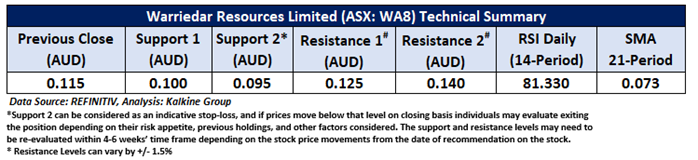
On the daily chart, WA8 is holding above a horizontal trendline support, signalling continued price stability and strength within the prevailing uptrend. The 14-period Relative Strength Index (RSI) is elevated at 81.33, indicating strong bullish momentum. Additionally, the stock remains above the 50-day Simple Moving Average (SMA), which serves as dynamic support and further confirms the positive trend. Key price levels to watch are support at AUD 0.100 and resistance at AUD 0.125.

Daily Technical Chart – WA8
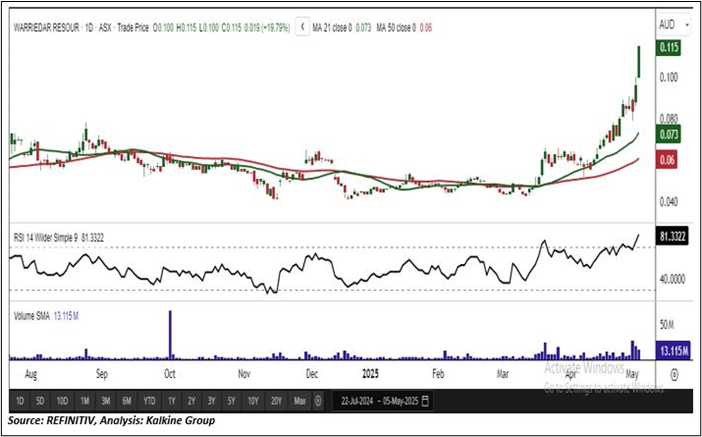
Considering the stock’s current price levels are trading above the horizontal trendline support, and momentum oscillator analysis, a “Speculative Buy” recommendation is given on the stock. The stock was analysed as per the closing price of AUD 0.115 per share as on May 05, 2025, up by 19.79%.
Note 1: Past performance is neither an Indicator nor a guarantee of future performance.
Note 2: Investment decision should be made depending on an individual’s appetite for upside potential, risks, and any previous holdings. This recommendation is purely based on technical analysis, and fundamental analysis has not been considered in this report.
Note 3: Related Risks: This report may be looked at from high-risk perspective and recommendations are provided are for a short duration. Recommendations provided in this report are solely based on technical parameters, and the fundamental performance of the stocks has not been considered in the decision-making process. Other factors which could impact the stock prices include market risks, regulatory risks, interest rates risks, currency risks, social and political instability risks etc.
The reference date for all price data, currency, technical indicators, support, and resistance levels is May 05, 2025. The reference data in this report has been partly sourced from REFINITIV.
Technical Indicators Defined:
Support: A level at which the stock prices tend to find support if they are falling, and a downtrend may take a pause backed by demand or buying interest. Support 1 refers to the nearby support level for the stock and if the price breaches the level, then Support 2 may act as the crucial support level for the stock.
Resistance: A level at which the stock prices tend to find resistance when they are rising, and an uptrend may take a pause due to profit booking or selling interest. Resistance 1 refers to the nearby resistance level for the stock and if the price surpasses the level, then Resistance 2 may act as the crucial resistance level for the stock.
Stop-loss: It is a level to protect further losses in case of unfavourable movement in the stock prices.
The Green colour line reflects the 21-period moving average. SMA helps to identify existing price trends. If the prices are trading above the 21-period, prices are currently in a bullish trend (Vice – Versa).
The Blue colour line reflects the 50-period moving average. SMA helps to identify existing price trends. If the prices are trading above the 50-period, prices are currently in a bullish trend (Vice – Versa).
The Orange/ Yellow colour line represents the Trendline.
The Purple colour line in the chart’s lower segment reflects the Relative Strength Index (14-Period), which indicates price momentum and signals momentum in trend. A reading of 70 or above suggests overbought status, while a reading of 30 or below suggests an oversold status.

 Please wait processing your request...