Company Overview: St George Mining Limited (ASX: SGQ) is engaged in the development of critical minerals projects across Brazil and Western Australia. Its portfolio includes the Araxá Project, Mt Alexander Project, Paterson Project, Broadview Project, Ajana Project, Lithium Star-WA Projects, and the Destiny Project. Notably, the Araxá Project in Minas Gerais, Brazil, is a niobium–rare earth element (REE) development. This Report covers the Price Action, Technical Indicators Analysis along with the Support Levels, Resistance Levels, and Recommendations on this stock.
Recent News:
On 10 September, SGQ sighed an MoU with REAlloys Inc (Ohio, USA) to commercialise rare earth materials from its Araxá Project, Brazil, targeting magnet-grade outputs (e.g. NdFeB, SmCo). The collaboration includes metallurgical test work, flowsheet optimisation, and exploring technologies (including leveraging REAlloys’ proprietary IP) to maximise recovery of high-value magnet rare earths. Drilling (auger, RC, diamond) is ongoing to upgrade the Mineral Resource Estimate (MRE) and explore undrilled areas. New assays reaffirm continuity and scale of REE + niobium mineralisation near-surface.
The Araxá deposit hosts ~40.6 Mt @ 4.13% TREO (Rare Earth Oxides) and has significant niobium content. It’s one of the highest-grade REE resources globally in carbonatite deposits. Araxá benefits from strong logistics, proximity to infrastructure, as well as local government support—permitting, approvals, and integration with Brazil’s MagBras initiative.
SGQ’s Technical Analysis:
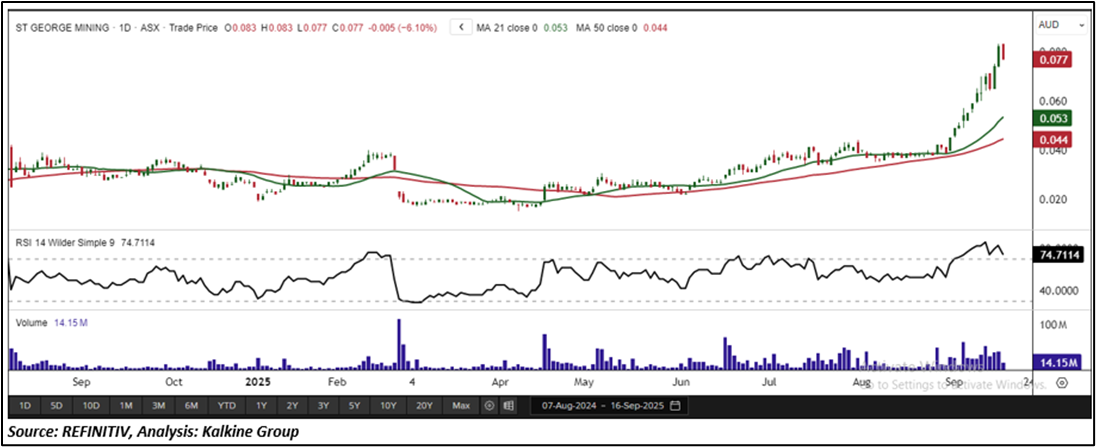
On the daily chart, SGQ is demonstrating notable technical strength as it continues to trade above its rising trendline support, a key indicator of underlying price stability and sustained investor confidence. The 14-period Relative Strength Index (RSI) currently reads 74.71, positioning the stock firmly in bullish territory and signalling the presence of strong upward momentum. Furthermore, the stock remains comfortably above its 50-period Simple Moving Average (SMA), which serves as an important dynamic support level, reinforcing the broader uptrend structure. Key price levels include critical support at AUD 0.068 and major resistance at AUD 0.088.
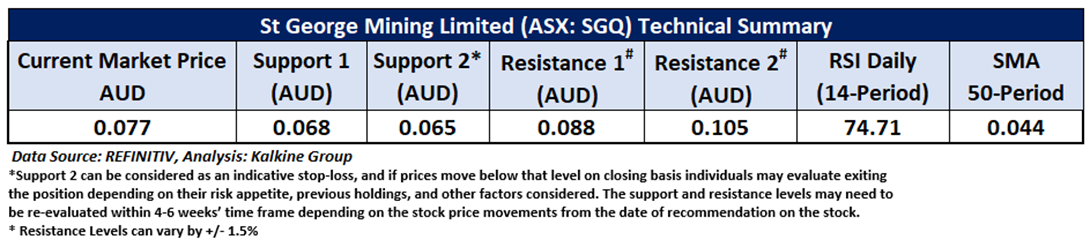

Daily Technical Chart – SGQ
Considering the stock’s current price levels are trading above the rising trendline support, and momentum oscillator analysis, a “Speculative Buy” recommendation is given on the stock. The stock was analysed as per the current market price of AUD 0.077 per share as on 16 September 2025 at 11:33 AM AEST, down by 6.10%.
Note 1: Past performance is neither an Indicator nor a guarantee of future performance.
Note 2: Investment decision should be made depending on an individual’s appetite for upside potential, risks, and any previous holdings. This recommendation is purely based on technical analysis, and fundamental analysis has not been considered in this report.
Note 3: Related Risks: This report may be looked at from high-risk perspective and recommendations are provided are for a short duration. Recommendations provided in this report are solely based on technical parameters, and the fundamental performance of the stocks has not been considered in the decision-making process. Other factors which could impact the stock prices include market risks, regulatory risks, interest rates risks, currency risks, social and political instability risks etc.
The reference date for all price data, currency, technical indicators, support, and resistance levels is September 16, 2025. The reference data in this report has been partly sourced from REFINITIV.
Technical Indicators Defined:
Support: A level at which the stock prices tend to find support if they are falling, and a downtrend may take a pause backed by demand or buying interest. Support 1 refers to the nearby support level for the stock and if the price breaches the level, then Support 2 may act as the crucial support level for the stock.
Resistance: A level at which the stock prices tend to find resistance when they are rising, and an uptrend may take a pause due to profit booking or selling interest. Resistance 1 refers to the nearby resistance level for the stock and if the price surpasses the level, then Resistance 2 may act as the crucial resistance level for the stock.
Stop-loss: It is a level to protect further losses in case of unfavourable movement in the stock prices.
The Green colour line reflects the 21-period moving average. SMA helps to identify existing price trends. If the prices are trading above the 21-period, prices are currently in a bullish trend (Vice – Versa).
The Blue colour line reflects the 50-period moving average. SMA helps to identify existing price trends. If the prices are trading above the 50-period, prices are currently in a bullish trend (Vice – Versa).
The Orange/ Yellow colour line represents the Trendline.
The Purple colour line in the chart’s lower segment reflects the Relative Strength Index (14-Period), which indicates price momentum and signals momentum in trend. A reading of 70 or above suggests overbought status, while a reading of 30 or below suggests an oversold status.

 Please wait processing your request...