Company Overview: Resolution Minerals Ltd (ASX: RML) is an Australian mineral exploration company focused on the acquisition, exploration, and development of precious and battery metals including gold, copper, cobalt, antimony, tungsten, uranium, and silica sands. The company operates projects primarily in Australia and the United States, with flagship assets such as the Wollogorang Copper Cobalt Project, Benmara Project, 64North Gold Project in Alaska, and the recently acquired Horse Heaven Antimony-Gold-Silver-Tungsten Project in Idaho, USA. This Report covers the Price Action, Technical Indicators Analysis along with the Support Levels, Resistance Levels, and Recommendations on this stock.
Key points from the recent news regarding Resolution Minerals Ltd:
- On 13 June 2025, Resolution Minerals updated it is fast-tracking a listing on the U.S. OTCQB market under the ticker RLMLF to enhance visibility and accessibility for North American investors, complementing its existing ASX listing. This dual listing aims to increase access to U.S. capital, enable trading in U.S. dollars, and broaden the investor base.
- On 11 June 2025, RML entered into a binding agreement to acquire the Horse Heaven Antimony-Gold-Tungsten Project located in Valley County, Idaho, USA. This project shares its eastern boundary with Perpetua Resources’ Stibnite Gold Project, which is the largest antimony project in North America and hosts a 4.8-million-ounce gold reserve along with significant antimony and tungsten resources.
- The project covers 699 federal lode mining claims over 5,644 hectares and includes past-producing antimony, tungsten, and gold mines at target zones such as Golden Gate and Antimony Ridge.
- Resolution Minerals will pay $1 million in cash and issue approximately 444.8 million shares plus 222.4 million options to the vendors as consideration for the acquisition.
- This acquisition strategically positions Resolution Minerals in a highly prospective critical minerals district in the U.S., targeting key minerals such as antimony, gold, silver, and tungsten, which are vital for industrial and defense applications. The proximity to a major established project and the planned exploration program offer potential to enhance the company's asset base and shareholder value
RML’s Technical Analysis:
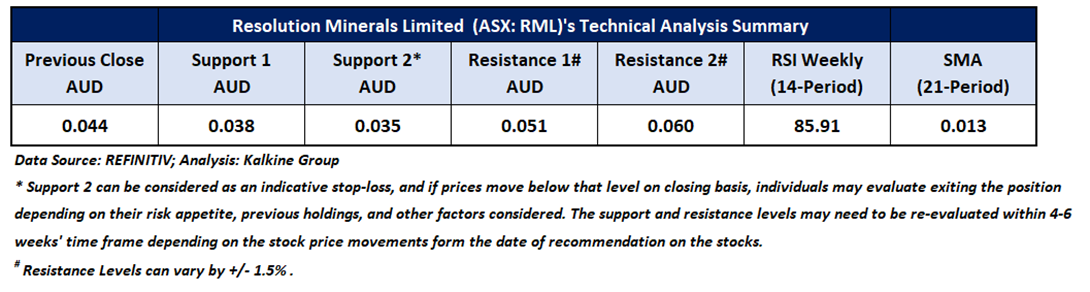
On the weekly chart, RML's stock price broke above a descending wedge pattern, signalling a positive trend. Prices are trading above both the 21-period and 50-day SMAs, which may potentially function as dynamic support levels for the stock; in contrast, the stock’s most recent high might act as a resistance level. In contrast, the RSI (14-period) is trading deep in its overbought region. Crucial support for the stock is positioned at AUD 0.038, while key resistance is placed at AUD 0.051.

Weekly Technical Chart – RML
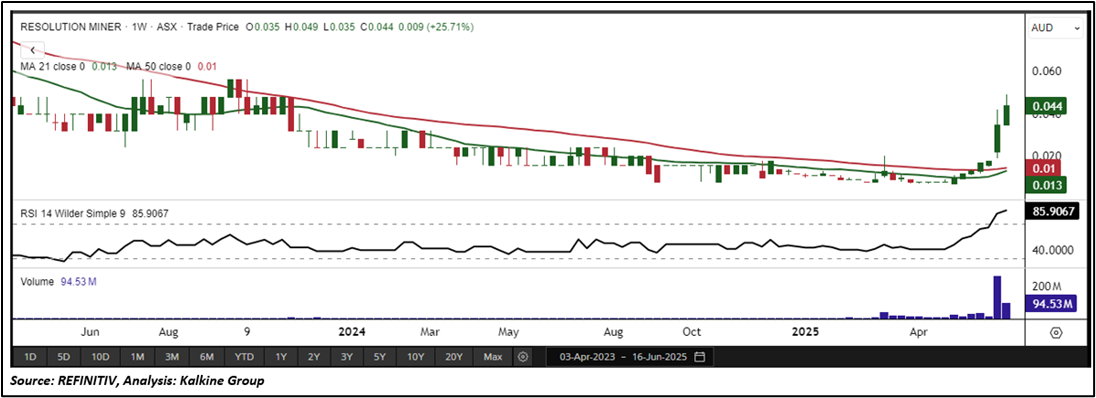
Considering the stock’s current price levels surpassing a descending wedge pattern, and momentum oscillator analysis, a “Speculative Buy” recommendation is given on the stock. The stock was analysed as per the closing price of AUD 0.044 per share as on 16 June 2025, up by 25.71%. Resolution Minerals Ltd (ASX: RML) was last covered in a report dated ’06 Oct 2022’.
Disclaimer: Resolution Minerals Ltd (Company) is a client of Kalkine Media Pty Ltd (Kalkine Media), an affiliate of Kalkine. However, under no circumstances have Kalkine or its related entities been, directly or indirectly influenced in making any recommendation concerning Company as contained in this report, and no form of compensation is or will be received by Kalkine, Kalkine Media or Kalkine’s other related entities for the publication of this report.
Note 1: Past performance is neither an Indicator nor a guarantee of future performance.
Note 2: Investment decision should be made depending on an individual’s appetite for upside potential, risks, and any previous holdings. This recommendation is purely based on technical analysis, and fundamental analysis has not been considered in this report.
Note 3: Related Risks: This report may be looked at from high-risk perspective and recommendations are provided are for a short duration. Recommendations provided in this report are solely based on technical parameters, and the fundamental performance of the stocks has not been considered in the decision-making process. Other factors which could impact the stock prices include market risks, regulatory risks, interest rates risks, currency risks, social and political instability risks etc.
The reference date for all price data, currency, technical indicators, support, and resistance levels is June 16, 2025. The reference data in this report has been partly sourced from REFINITIV.
Technical Indicators Defined:
Support: A level at which the stock prices tend to find support if they are falling, and a downtrend may take a pause backed by demand or buying interest. Support 1 refers to the nearby support level for the stock and if the price breaches the level, then Support 2 may act as the crucial support level for the stock.
Resistance: A level at which the stock prices tend to find resistance when they are rising, and an uptrend may take a pause due to profit booking or selling interest. Resistance 1 refers to the nearby resistance level for the stock and if the price surpasses the level, then Resistance 2 may act as the crucial resistance level for the stock.
Stop-loss: It is a level to protect further losses in case of unfavourable movement in the stock prices.
The Green colour line reflects the 21-period moving average. SMA helps to identify existing price trends. If the prices are trading above the 21-period, prices are currently in a bullish trend (Vice – Versa).
The Blue colour line reflects the 50-period moving average. SMA helps to identify existing price trends. If the prices are trading above the 50-period, prices are currently in a bullish trend (Vice – Versa).
The Orange/ Yellow colour line represents the Trendline.
The Purple colour line in the chart’s lower segment reflects the Relative Strength Index (14-Period), which indicates price momentum and signals momentum in trend. A reading of 70 or above suggests overbought status, while a reading of 30 or below suggests an oversold status.

 Please wait processing your request...