Company Overview: Kaili Resources Limited (ASX: KLR) is an Australia-based exploration company focused on base metals, cobalt, gold, and rare earth elements. Its project portfolio includes the Yilgarn Craton (Gindalbie) Gold and Critical Metals Project, the Limestone Coast Rare Earth Element Project, the Halls Creek Gold, Cobalt, Nickel and Copper Project, and the Tennant Creek Gold and Copper Project. This Report covers the Price Action, Technical Indicators Analysis along with the Support Levels, Resistance Levels, and Recommendations on this stock.
Recent News:
On 15 September 2025, Kaili Resources Limited announced that it has completed an extensive aircore drilling program targeting rare earth elements (REEs) across its Limestone Coast Project, spanning the Lameroo, Coodalya, and Karte tenements in South Australia. The campaign involved 54 shallow drill holes totaling 973 metres, with 973 samples collected for immediate pXRF screening; those with high-grade indications will proceed to laboratory assay, with final confirmed results expected by mid-October 2025. The project covers areas within the Loxton/Parilla Sands, a region known for ionic clay-hosted REE mineralization.
KLR’s Technical Analysis:
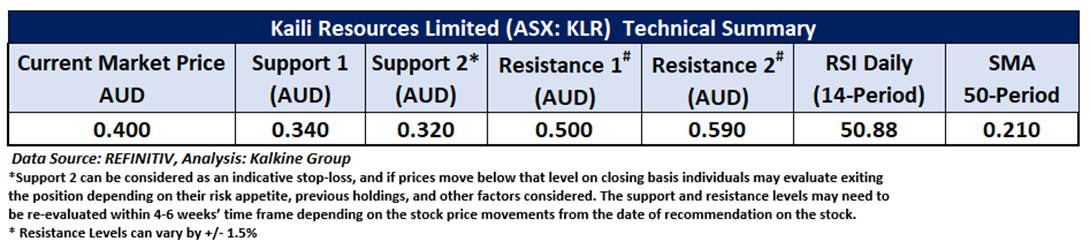
On the daily chart, KLR is trading above its horizontal trendline support level, signalling price stability. The 14-period Relative Strength Index (RSI) stands at 50.88, suggesting healthy bullish momentum. Moreover, the stock is holding above its 50-period Simple Moving Average (SMA), which continues to act as dynamic support and reinforces the prevailing uptrend. Key price levels include critical support at AUD 0.340 and major resistance at AUD 0.500.

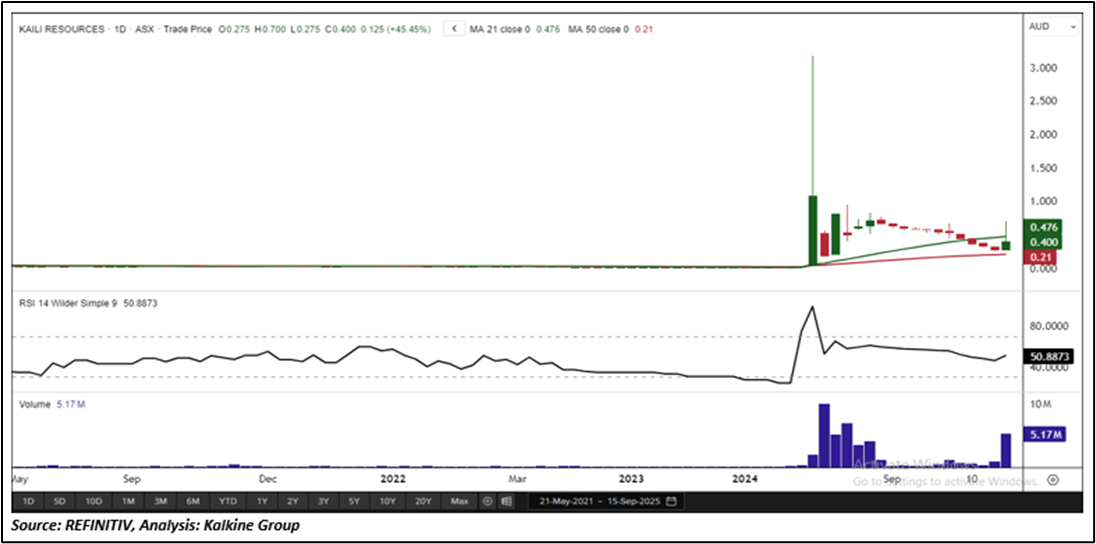
Daily Technical Chart – KLR
Considering the stock’s current price levels are trading above the horizontal trendline support, and momentum oscillator analysis, a “Speculative Buy” recommendation is given on the stock. The stock was analysed as per the current market price of AUD 0.400 per share as on 15 September 2025 at 1:01 PM AEST, up by 45.45%.
Note 1: Past performance is neither an Indicator nor a guarantee of future performance.
Note 2: Investment decision should be made depending on an individual’s appetite for upside potential, risks, and any previous holdings. This recommendation is purely based on technical analysis, and fundamental analysis has not been considered in this report.
Note 3: Related Risks: This report may be looked at from high-risk perspective and recommendations are provided are for a short duration. Recommendations provided in this report are solely based on technical parameters, and the fundamental performance of the stocks has not been considered in the decision-making process. Other factors which could impact the stock prices include market risks, regulatory risks, interest rates risks, currency risks, social and political instability risks etc.
The reference date for all price data, currency, technical indicators, support, and resistance levels is September 15, 2025. The reference data in this report has been partly sourced from REFINITIV.
Technical Indicators Defined:
Support: A level at which the stock prices tend to find support if they are falling, and a downtrend may take a pause backed by demand or buying interest. Support 1 refers to the nearby support level for the stock and if the price breaches the level, then Support 2 may act as the crucial support level for the stock.
Resistance: A level at which the stock prices tend to find resistance when they are rising, and an uptrend may take a pause due to profit booking or selling interest. Resistance 1 refers to the nearby resistance level for the stock and if the price surpasses the level, then Resistance 2 may act as the crucial resistance level for the stock.
Stop-loss: It is a level to protect further losses in case of unfavourable movement in the stock prices.
The Green colour line reflects the 21-period moving average. SMA helps to identify existing price trends. If the prices are trading above the 21-period, prices are currently in a bullish trend (Vice – Versa).
The Blue colour line reflects the 50-period moving average. SMA helps to identify existing price trends. If the prices are trading above the 50-period, prices are currently in a bullish trend (Vice – Versa).
The Orange/ Yellow colour line represents the Trendline.
The Purple colour line in the chart’s lower segment reflects the Relative Strength Index (14-Period), which indicates price momentum and signals momentum in trend. A reading of 70 or above suggests overbought status, while a reading of 30 or below suggests an oversold status.

 Please wait processing your request...