Company Overview: European Metals Holdings Limited (ASX: EMH) is an Australia-based mineral exploration and development company focused on advancing the Cinovec Project, a vertically integrated battery metals initiative in the Czech Republic. This Report covers the Price Action, Technical Indicators Analysis along with the Support Levels, Resistance Levels, and Recommendations on this stock.
EMH’s Technical Analysis:
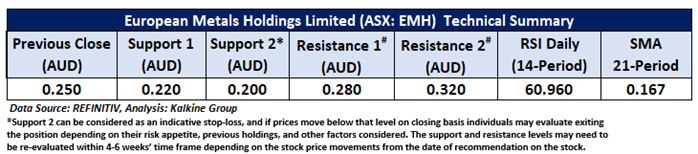
On the daily chart, EMH is encountering resistance at its horizontal trendline level, indicating that price action remains under pressure. The 14-period Relative Strength Index (RSI) stands at 60.11, reflecting weakening momentum and a shift in sentiment. However, the stock continues to trade above the 21-period Simple Moving Average (SMA), which acts as dynamic support, helping to sustain the overall trend. Key levels to monitor include critical support at AUD 0.220 and major resistance at AUD 0.280.
Daily Technical Chart – EMH
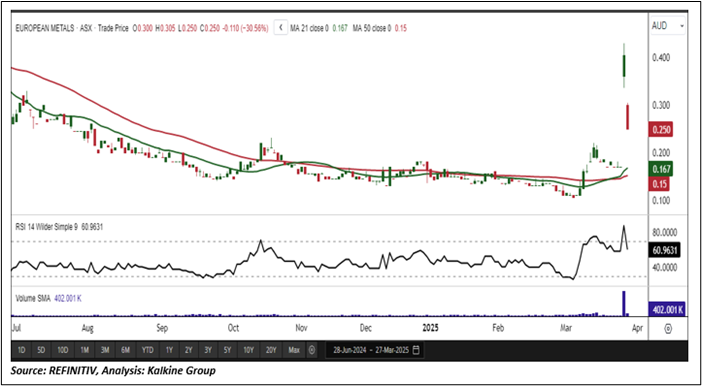
Considering the stock’s current price is facing resistance from the horizontal trendline, and momentum oscillator analysis, a “Watch” recommendation is given on the stock. The stock was analysed as per the closing price of AUD 0.250 per share as on 27 March 2025, down by 30.56%. European Metals Holdings Limited (ASX: EMH) was last covered in a report dated ’17 March 2022’.
Individuals can evaluate the stock based on the support and resistance levels provided in the report in case of keen interest, taking into consideration the risk-reward scenario.
Note 1: Past performance is neither an Indicator nor a guarantee of future performance.
Note 2: Investment decision should be made depending on an individual’s appetite for upside potential, risks, and any previous holdings. This recommendation is purely based on technical analysis, and fundamental analysis has not been considered in this report.
Note 3: Related Risks: This report may be looked at from high-risk perspective and recommendations are provided are for a short duration. Recommendations provided in this report are solely based on technical parameters, and the fundamental performance of the stocks has not been considered in the decision-making process. Other factors which could impact the stock prices include market risks, regulatory risks, interest rates risks, currency risks, social and political instability risks etc.
The reference date for all price data, currency, technical indicators, support, and resistance levels is March 27, 2025. The reference data in this report has been partly sourced from REFINITIV.
Technical Indicators Defined:
Support: A level at which the stock prices tend to find support if they are falling, and a downtrend may take a pause backed by demand or buying interest. Support 1 refers to the nearby support level for the stock and if the price breaches the level, then Support 2 may act as the crucial support level for the stock.
Resistance: A level at which the stock prices tend to find resistance when they are rising, and an uptrend may take a pause due to profit booking or selling interest. Resistance 1 refers to the nearby resistance level for the stock and if the price surpasses the level, then Resistance 2 may act as the crucial resistance level for the stock.
Stop-loss: It is a level to protect further losses in case of unfavourable movement in the stock prices.
The Green colour line reflects the 21-period moving average. SMA helps to identify existing price trends. If the prices are trading above the 21-period, prices are currently in a bullish trend (Vice – Versa).
The Blue colour line reflects the 50-period moving average. SMA helps to identify existing price trends. If the prices are trading above the 50-period, prices are currently in a bullish trend (Vice – Versa).
The Orange/ Yellow colour line represents the Trendline.
The Purple colour line in the chart’s lower segment reflects the Relative Strength Index (14-Period), which indicates price momentum and signals momentum in trend. A reading of 70 or above suggests overbought status, while a reading of 30 or below suggests an oversold status.

 Please wait processing your request...