Company Overview: American Rare Earths Limited (ASX: ARR) is an Australia-based critical minerals company focused on the exploration and development of rare earth resources. Through its wholly owned subsidiary, Wyoming Rare (USA) Inc., the company is advancing the Halleck Creek Project in Wyoming, a significant rare earth deposit. This Report covers the Price Action, Technical Indicators Analysis along with the Support Levels, Resistance Levels, and Recommendations on this stock.
ARR’s Technical Analysis:
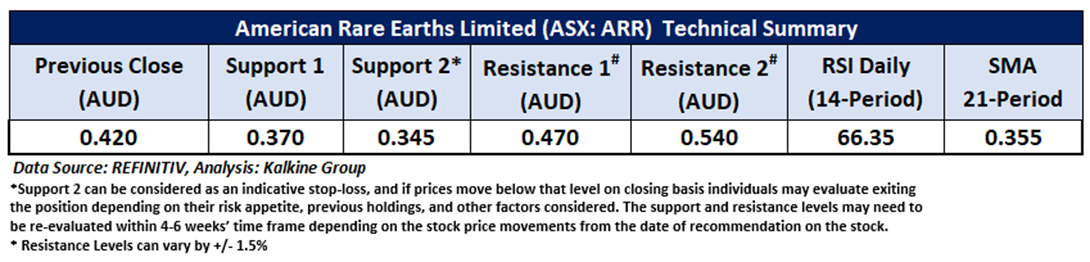
On the daily chart, ARR is holding above horizontal trendline support, signalling scope for further upside. The 14-period RSI stands at 66.35, reflecting strong buying momentum. The stock is trading well above its 21-period SMA, which continues to act as a key trend indicator and reinforces the prevailing bullish outlook. Crucial support is noted at AUD 0.370, while key resistance is placed at AUD 0.470. Sustaining above support will be essential to maintain bullish momentum, while a breakout above resistance could open the way for further gains.

Daily Technical Chart – ARR
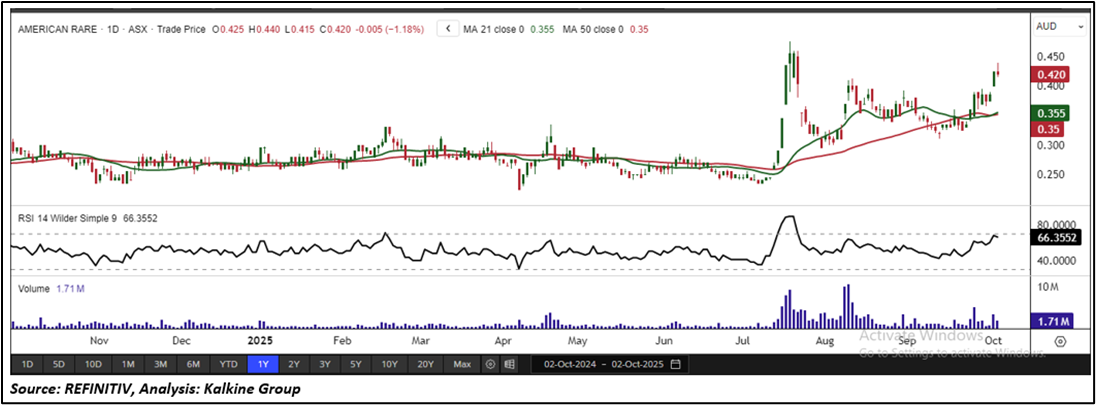
Considering the stock’s current prices are trading above the horizontal trendline support, and momentum oscillator analysis, a “Speculative Buy” recommendation is given on the stock. The stock was analysed as per the closing price of AUD 0.420 per share as on 02 October 2025, down by 1.18%. American Rare Earths Limited (ASX: ARR) was last covered in a report dated ’30 January 2023’.
Note 1: Past performance is neither an Indicator nor a guarantee of future performance.
Note 2: Investment decision should be made depending on an individual’s appetite for upside potential, risks, and any previous holdings. This recommendation is purely based on technical analysis, and fundamental analysis has not been considered in this report.
Note 3: Related Risks: This report may be looked at from high-risk perspective and recommendations are provided are for a short duration. Recommendations provided in this report are solely based on technical parameters, and the fundamental performance of the stocks has not been considered in the decision-making process. Other factors which could impact the stock prices include market risks, regulatory risks, interest rates risks, currency risks, social and political instability risks etc.
The reference date for all price data, currency, technical indicators, support, and resistance levels is October 02, 2025. The reference data in this report has been partly sourced from REFINITIV.
Technical Indicators Defined:
Support: A level at which the stock prices tend to find support if they are falling, and a downtrend may take a pause backed by demand or buying interest. Support 1 refers to the nearby support level for the stock and if the price breaches the level, then Support 2 may act as the crucial support level for the stock.
Resistance: A level at which the stock prices tend to find resistance when they are rising, and an uptrend may take a pause due to profit booking or selling interest. Resistance 1 refers to the nearby resistance level for the stock and if the price surpasses the level, then Resistance 2 may act as the crucial resistance level for the stock.
Stop-loss: It is a level to protect further losses in case of unfavourable movement in the stock prices.
The Green colour line reflects the 21-period moving average. SMA helps to identify existing price trends. If the prices are trading above the 21-period, prices are currently in a bullish trend (Vice – Versa).
The Blue colour line reflects the 50-period moving average. SMA helps to identify existing price trends. If the prices are trading above the 50-period, prices are currently in a bullish trend (Vice – Versa).
The Orange/ Yellow colour line represents the Trendline.
The Purple colour line in the chart’s lower segment reflects the Relative Strength Index (14-Period), which indicates price momentum and signals momentum in trend. A reading of 70 or above suggests overbought status, while a reading of 30 or below suggests an oversold status.

 Please wait processing your request...