Company Overview: Aeris Resources Limited (ASX:AIS) is an Australia-based diversified mining and exploration company, primarily focused on copper, with additional exposure to gold, zinc, and silver. Headquartered in Brisbane, the company operates several assets across Australia. This stock was added to the S&P/ASX All Ordinaries index with effect from 24 March 2025. This Report covers the Price Action, Technical Indicators Analysis along with the Support Levels, Resistance Levels, and Recommendations on this stock.
Recent Updates:
The company reported a significant turnaround in its FY25 half-year results, achieving a profit after tax of AUD 29.6 million, compared to a loss of AUD 18.8 million in the previous corresponding period. Revenues of the company increased to AUD 292.7 million vs AUD 286.3 million in H1FY24, driven by higher commodity prices and increased gold production.
On 31 March 2025, AIS announced a substantial upgrade to the Mineral Resource Estimate (MRE) at its Constellation deposit within the Tritton tenement in New South Wales. The updated MRE now stands at 7.6 million tonnes, grading 2.01% copper, 0.66g/t gold, and 2.5g/t silver, containing 153 thousand tonnes of copper, 161 thousand ounces of gold, and 608 thousand ounces of silver. This represents a 24% increase in contained copper and a 29% rise in contained gold compared to the previous MRE.
AIS’ Technical Analysis:
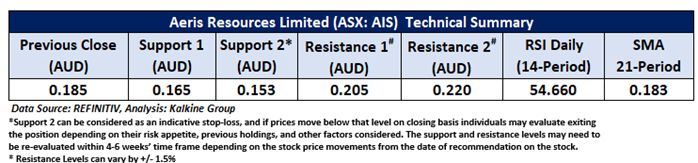
On the daily chart, AIS is trading above a descending trendline support zone, reflecting sustained bullish sentiment. The 14-period Relative Strength Index (RSI) is holding around 54.66, suggesting ongoing positive momentum. Additionally, the price remains above the 50-period Simple Moving Average (SMA), which continues to act as dynamic support. Key technical levels to monitor include support at AUD 0.165 and resistance at AUD 0.205.

Daily Technical Chart – AIS
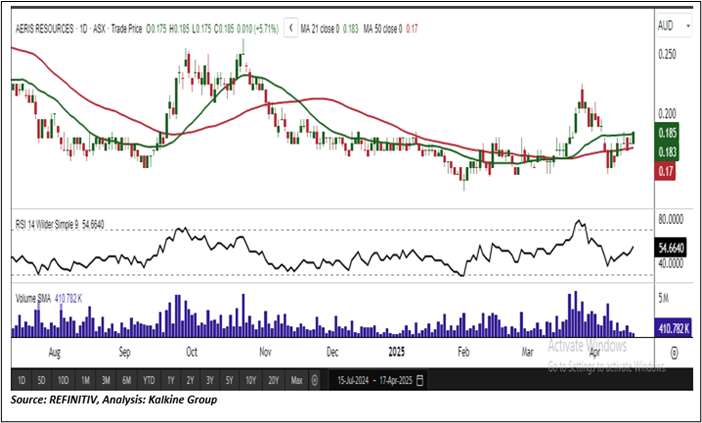
Considering the stock’s current prices are trading above horizontal trendline support, and momentum oscillator analysis, a “Speculative Buy” recommendation is given on the stock. The stock was analysed as per the closing price of AUD 0.185 per share as on 17 April 2025, up by 5.71%. Aeris Resources Limited (ASX: AIS) was last covered in a report dated ’20 March 2025’.
Note 1: Past performance is neither an Indicator nor a guarantee of future performance.
Note 2: Investment decision should be made depending on an individual’s appetite for upside potential, risks, and any previous holdings. This recommendation is purely based on technical analysis, and fundamental analysis has not been considered in this report.
Note 3: Related Risks: This report may be looked at from high-risk perspective and recommendations are provided are for a short duration. Recommendations provided in this report are solely based on technical parameters, and the fundamental performance of the stocks has not been considered in the decision-making process. Other factors which could impact the stock prices include market risks, regulatory risks, interest rates risks, currency risks, social and political instability risks etc.
The reference date for all price data, currency, technical indicators, support, and resistance levels is April 17, 2025. The reference data in this report has been partly sourced from REFINITIV.
Technical Indicators Defined:
Support: A level at which the stock prices tend to find support if they are falling, and a downtrend may take a pause backed by demand or buying interest. Support 1 refers to the nearby support level for the stock and if the price breaches the level, then Support 2 may act as the crucial support level for the stock.
Resistance: A level at which the stock prices tend to find resistance when they are rising, and an uptrend may take a pause due to profit booking or selling interest. Resistance 1 refers to the nearby resistance level for the stock and if the price surpasses the level, then Resistance 2 may act as the crucial resistance level for the stock.
Stop-loss: It is a level to protect further losses in case of unfavourable movement in the stock prices.
The Green colour line reflects the 21-period moving average. SMA helps to identify existing price trends. If the prices are trading above the 21-period, prices are currently in a bullish trend (Vice – Versa).
The Blue colour line reflects the 50-period moving average. SMA helps to identify existing price trends. If the prices are trading above the 50-period, prices are currently in a bullish trend (Vice – Versa).
The Orange/ Yellow colour line represents the Trendline.
The Purple colour line in the chart’s lower segment reflects the Relative Strength Index (14-Period), which indicates price momentum and signals momentum in trend. A reading of 70 or above suggests overbought status, while a reading of 30 or below suggests an oversold status.

 Please wait processing your request...