Company Overview: Microba Life Sciences Limited (ASX: MAP) provides microbiome testing, supplements, and analysis services in Australia, Europe, New Zealand, the United Arab Emirates, the United Kingdom, the United States, Asia, and Ireland. It operates through two segments, Testing Services and Supplements, and Research and Development. This Report covers the Price Action, Technical Indicators Analysis along with the Support Levels, Resistance Levels, and Recommendations on this stock.
Recent Update: On 14 May 2025, MAP released preliminary results from over 4,600 MetaXplore™ GI Plus tests, designed to assess and manage chronic lower gastrointestinal disorders. The test identified clinically relevant findings—such as gut bacteria imbalances, infections, or inflammation—in over 70% of cases, often missed by conventional diagnostics. A follow-up survey showed two-thirds of patients reported symptom improvement after care guided by test results. These findings underscore MetaXplore’s clinical value and potential to redefine care standards. The addressable market spans 82.2 million patients across the US, UK, Europe, and Australia, signaling significant global impact.
Financial Performance for the Quarter Ended 31 March 2025.
- Testing Growth: MAP saw significant growth in its testing business, with MetaXplore sales in Australia up 201% year-on-year to 3,225 tests in Q3. MetaPanel sales also surged 1,827%, driven by increasing clinician adoption and key partnerships, including The Colonoscopy Clinic. UK test sales grew rapidly, with a 98.6% month-on-month increase.
- Financial Performance: Q3 cash receipts rose 5% YoY to AUD 4.23mn, with core testing and supplements revenue up 3%. Total Q3 revenue was AUD 3.4mn, impacted by the strategic shift of research services.
- Strategic Focus and Expansion: The company is shifting to a sales- and partnership-led model for its Therapeutics business and advancing U.S. market entry with a targeted, phased strategy. The company holds AUD 12.41mn in cash as of 31 March 2025, supporting its growth and commercialization plans. FY25 revenue is projected between AUD 15.25mn–AUD 16.25mn (up 26%–34% YoY).
MAP’s Technical Analysis:
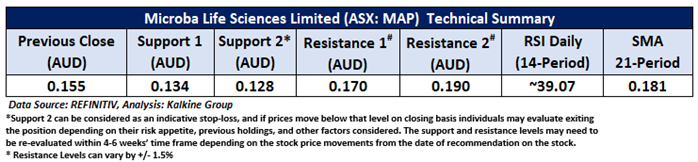
On the daily chart, MAP is holding above its horizontal trendline support, suggesting a degree of price stability despite recent weakness. The 14-period Relative Strength Index (RSI) sits at 39.07, approaching oversold territory, which could indicate potential for a rebound. However, the stock is still trading below the 21-period Simple Moving Average (SMA), which continues to serve as dynamic resistance. Key technical levels to watch include strong support at AUD 0.134 and major resistance at AUD 0.170. A break above the SMA could signal renewed bullish momentum, while a drop below support may trigger further downside.

Daily Technical Chart – MAP
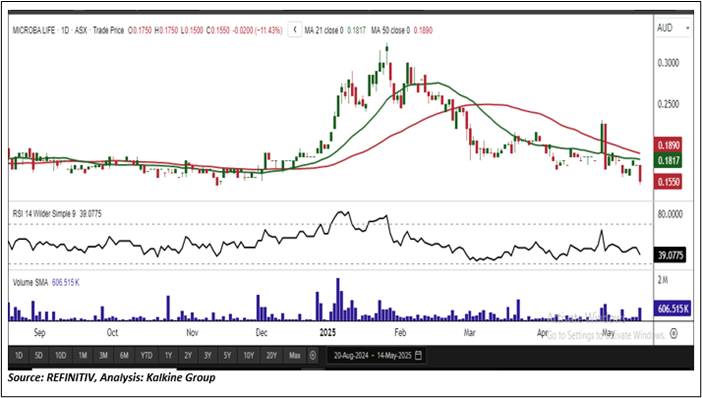
Considering the stock’s current price levels are trading above the horizontal trendline support, and momentum oscillator analysis, a “Speculative Buy” recommendation is given on the stock. The stock was analysed as per the closing price of AUD 0.155 per share as on 14 May 2025, down by 11.43%.
Note 1: Past performance is neither an Indicator nor a guarantee of future performance.
Note 2: Investment decision should be made depending on an individual’s appetite for upside potential, risks, and any previous holdings. This recommendation is purely based on technical analysis, and fundamental analysis has not been considered in this report.
Note 3: Related Risks: This report may be looked at from high-risk perspective and recommendations are provided are for a short duration. Recommendations provided in this report are solely based on technical parameters, and the fundamental performance of the stocks has not been considered in the decision-making process. Other factors which could impact the stock prices include market risks, regulatory risks, interest rates risks, currency risks, social and political instability risks etc.
The reference date for all price data, currency, technical indicators, support, and resistance levels is May 14, 2025. The reference data in this report has been partly sourced from REFINITIV.
Technical Indicators Defined:
Support: A level at which the stock prices tend to find support if they are falling, and a downtrend may take a pause backed by demand or buying interest. Support 1 refers to the nearby support level for the stock and if the price breaches the level, then Support 2 may act as the crucial support level for the stock.
Resistance: A level at which the stock prices tend to find resistance when they are rising, and an uptrend may take a pause due to profit booking or selling interest. Resistance 1 refers to the nearby resistance level for the stock and if the price surpasses the level, then Resistance 2 may act as the crucial resistance level for the stock.
Stop-loss: It is a level to protect further losses in case of unfavourable movement in the stock prices.
The Green colour line reflects the 21-period moving average. SMA helps to identify existing price trends. If the prices are trading above the 21-period, prices are currently in a bullish trend (Vice – Versa).
The Blue colour line reflects the 50-period moving average. SMA helps to identify existing price trends. If the prices are trading above the 50-period, prices are currently in a bullish trend (Vice – Versa).
The Orange/ Yellow colour line represents the Trendline.
The Purple colour line in the chart’s lower segment reflects the Relative Strength Index (14-Period), which indicates price momentum and signals momentum in trend. A reading of 70 or above suggests overbought status, while a reading of 30 or below suggests an oversold status.

 Please wait processing your request...