Company Overview: EBR Systems Inc. (ASX: EBR) is a medical device company specializing in wireless cardiac stimulation technology aimed at treating patients with cardiac rhythm diseases. Their key product, the Wise CRT System, uses proprietary wireless technology to deliver cardiac pacing directly inside the left ventricle of the heart, overcoming limitations of traditional cardiac resynchronization therapy (CRT) by eliminating the need for leads that typically cause complications. This Report covers the Price Action, Technical Indicators Analysis along with the Support Levels, Resistance Levels, and Recommendations on this stock.
Recent News:
EBR announced on 22 September 2025 that the U.S. Centers for Medicare & Medicaid Services (CMS) granted final approval for Transitional Pass-Through (TPT) reimbursement of its WiSE® CRT System, effective from 1 October 2025 for three years. This reimbursement allows U.S. hospitals to receive additional Medicare payments for outpatient use of the WiSE System, supporting broader adoption of the technology.
Key Highlights of Q2 FY25 (for the quarterly period ended 30 June 2025)
EBR raised AU$75.9 million to advance commercialization, ending the quarter with US$87.2 million in cash and equivalents. Financially, the company recorded a net loss of US$12 million for Q2, with operating expenses rising due to increased sales, marketing, and corporate activities post-FDA approval, while research and development costs declined.
Key milestones include FDA approval of its WiSE® CRT System, the first leadless left ventricular endocardial pacing device, and successful first commercial implants in leading U.S. medical centers. The company secured key Medicare reimbursement approvals: New Technology Add-On Payment (NTAP) for inpatient use and preliminary Transitional Pass-Through (TPT) for outpatient use, both effective October 2025, supporting broader adoption.
EBR’s Technical Analysis:
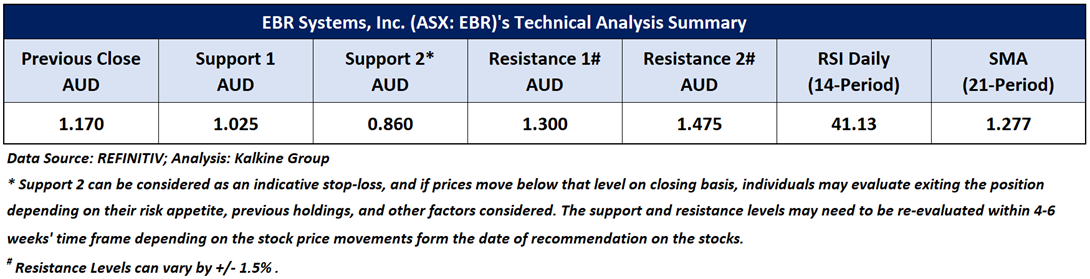
On the daily chart, EBR's stock price is rebounding from the lower boundary of a trading range, signalling a positive trend. Additionally, the RSI (14-period) is bouncing back near its oversold territory, providing further support for the mentioned recommendation. Prices are trading between its previous peak and trough, which may potentially function as resistance and support levels for the stock, respectively. Crucial support for the stock is positioned at AUD 1.025, while key resistance is placed at AUD 1.475.

Daily Technical Chart – EBR
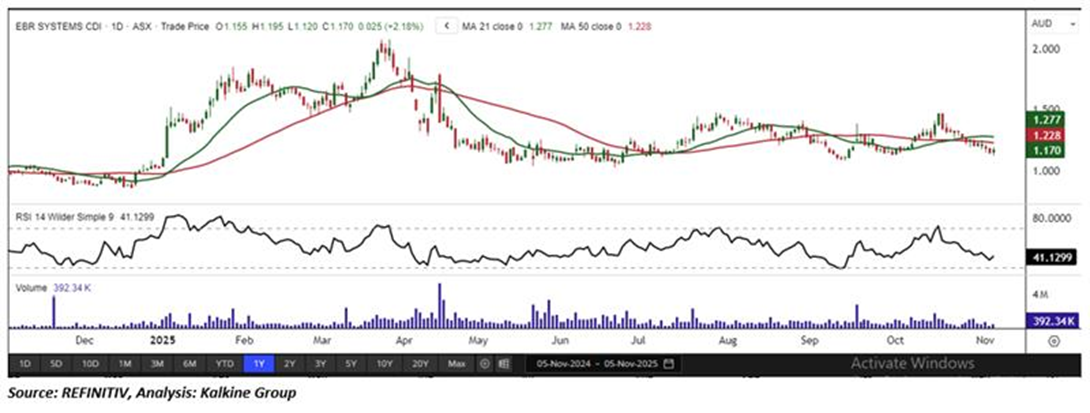
Considering the stock’s current price levels rebounding from the lower boundary of a trading range, and momentum oscillator analysis, a “Speculative Buy” recommendation is given on the stock. The stock was analysed as per the closing price of AUD 1.170 per share as on 05 November 2025, up by 2.18%. EBR Systems Inc. (ASX: EBR) was last covered in a report dated ’08 January 2025’.
Note 1: Past performance is neither an Indicator nor a guarantee of future performance.
Note 2: Investment decision should be made depending on an individual’s appetite for upside potential, risks, and any previous holdings. This recommendation is purely based on technical analysis, and fundamental analysis has not been considered in this report.
Note 3: Related Risks: This report may be looked at from high-risk perspective and recommendations are provided are for a short duration. Recommendations provided in this report are solely based on technical parameters, and the fundamental performance of the stocks has not been considered in the decision-making process. Other factors which could impact the stock prices include market risks, regulatory risks, interest rates risks, currency risks, social and political instability risks etc.
The reference date for all price data, currency, technical indicators, support, and resistance levels is November 05, 2025. The reference data in this report has been partly sourced from REFINITIV.
Technical Indicators Defined:
Support: A level at which the stock prices tend to find support if they are falling, and a downtrend may take a pause backed by demand or buying interest. Support 1 refers to the nearby support level for the stock and if the price breaches the level, then Support 2 may act as the crucial support level for the stock.
Resistance: A level at which the stock prices tend to find resistance when they are rising, and an uptrend may take a pause due to profit booking or selling interest. Resistance 1 refers to the nearby resistance level for the stock and if the price surpasses the level, then Resistance 2 may act as the crucial resistance level for the stock.
Stop-loss: It is a level to protect further losses in case of unfavourable movement in the stock prices.
The Green colour line reflects the 21-period moving average. SMA helps to identify existing price trends. If the prices are trading above the 21-period, prices are currently in a bullish trend (Vice – Versa).
The Blue colour line reflects the 50-period moving average. SMA helps to identify existing price trends. If the prices are trading above the 50-period, prices are currently in a bullish trend (Vice – Versa).
The Orange/ Yellow colour line represents the Trendline.
The Purple colour line in the chart’s lower segment reflects the Relative Strength Index (14-Period), which indicates price momentum and signals momentum in trend. A reading of 70 or above suggests overbought status, while a reading of 30 or below suggests an oversold status.

 Please wait processing your request...