Company Overview: Beforepay Group Limited (ASX: B4P), established in 2019, focuses on offering financial solutions to working Australians who have traditionally been underserved by conventional financial services. The company operates within the emerging Pay on Demand sector, a fresh and appealing concept for potential customers. This Report covers the Price Action, Technical Indicators Analysis along with the Support Levels, Resistance Levels, and Recommendations on this stock.
Financial Highlights: In 1HFY25, the company achieved a net profit before tax (NPBT) of AUD 2.8mm and EBITDA of AUD 5.5mm, with revenue growing 12% YoY to AUD 19.7mn. The company saw a decline in net defaults to 1.1%, down 13% YoY, driven by improved risk management and credit model upgrades, alongside recoveries of AUD 4.3mn. Net transaction margin rose 18% YoY to AUD 11.8mn, fueled by higher advance volumes and lower defaults.
Operating expenses rose to AUD 8.8mn due to a one-off share-based payment adjustment. The company maintained a healthy financial position with AUD 18.3mn in cash and equity of AUD 35.6mn. In 2QFY25, the company launched its new Personal Loan product, providing customers with larger loan amounts and longer repayment terms compared to the Pay Advance product.
Outlook: Looking forward, the company is focused on driving growth across key areas: sustaining the momentum of the Pay Advance product while refining risk models and controlling costs; strengthening the Personal Loans offering by enhancing risk models and processes, preparing for scalability, and securing additional debt funding; and investing in Carrington Labs to fuel growth, onboard new clients—especially in the US—and continue enhancing the product.
B4P’s Technical Analysis:
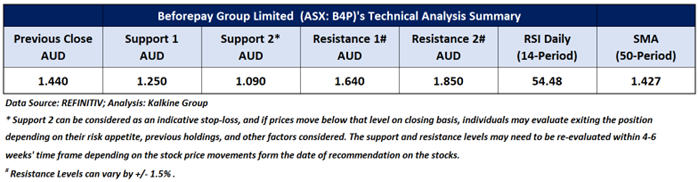
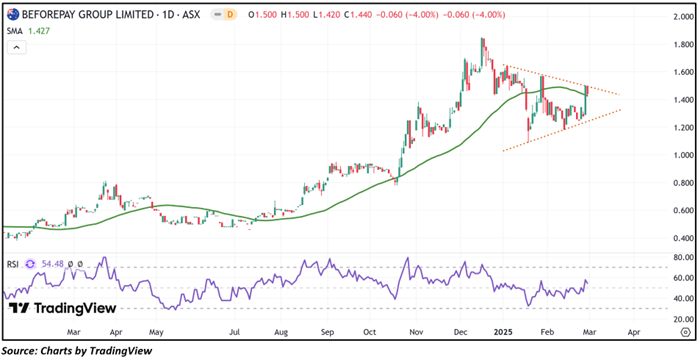
On the daily chart, B4P's stock price is forming a symmetrical triangle pattern during an uptrend, signalling a positive bias. Additionally, the RSI (14-period) is trading above its midpoint, providing further support for the mentioned recommendation. Prices are trading above both the 21-period and 50-day SMAs, which may potentially function as dynamic support levels for the stock; in contrast, the stock’s most recent high might act as a resistance level. Crucial support for the stock is positioned at AUD 1.250, while key resistance is placed at AUD 1.640.

Daily Technical Chart – B4P
Considering the stock’s current price levels forming higher peaks and higher troughs, and momentum oscillator analysis, a “Speculative Buy” recommendation is given on the stock. The stock was analysed as per the closing price of AUD 1.440 per share as on 28 February 2025, down by 4.00%. Beforepay Group Limited (ASX: B4P) was last covered in a report dated ’16 February 2022’.
Note 1: Past performance is neither an Indicator nor a guarantee of future performance.
Note 2: Investment decision should be made depending on an individual’s appetite for upside potential, risks, and any previous holdings. This recommendation is purely based on technical analysis, and fundamental analysis has not been considered in this report.
Note 3: Related Risks: This report may be looked at from high-risk perspective and recommendations are provided are for a short duration. Recommendations provided in this report are solely based on technical parameters, and the fundamental performance of the stocks has not been considered in the decision-making process. Other factors which could impact the stock prices include market risks, regulatory risks, interest rates risks, currency risks, social and political instability risks etc.
The reference date for all price data, currency, technical indicators, support, and resistance levels is February 28, 2025. The reference data in this report has been partly sourced from REFINITIV.
Technical Indicators Defined:
Support: A level at which the stock prices tend to find support if they are falling, and a downtrend may take a pause backed by demand or buying interest. Support 1 refers to the nearby support level for the stock and if the price breaches the level, then Support 2 may act as the crucial support level for the stock.
Resistance: A level at which the stock prices tend to find resistance when they are rising, and an uptrend may take a pause due to profit booking or selling interest. Resistance 1 refers to the nearby resistance level for the stock and if the price surpasses the level, then Resistance 2 may act as the crucial resistance level for the stock.
Stop-loss: It is a level to protect further losses in case of unfavourable movement in the stock prices.
The Green colour line reflects the 21-period moving average. SMA helps to identify existing price trends. If the prices are trading above the 21-period, prices are currently in a bullish trend (Vice – Versa).
The Blue colour line reflects the 50-period moving average. SMA helps to identify existing price trends. If the prices are trading above the 50-period, prices are currently in a bullish trend (Vice – Versa).
The Orange/ Yellow colour line represents the Trendline.
The Purple colour line in the chart’s lower segment reflects the Relative Strength Index (14-Period), which indicates price momentum and signals momentum in trend. A reading of 70 or above suggests overbought status, while a reading of 30 or below suggests an oversold status.

 Please wait processing your request...