Company Overview: Elevate Uranium Ltd (ASX: EL8) is a uranium exploration and development company with key projects in Namibia and Australia. The company holds a 75% interest in the Marenica uranium project in Namibia, one of its flagship assets. This Report covers the Price Action, Technical Indicators Analysis along with the Support Levels, Resistance Levels, and Recommendations on this stock.
Recent Updates:
Elevate Uranium Ltd’s H1 FY25 results reflected a company in active exploration and development phase, with no operating revenue and a net loss of AUD 7.57 million, up from AUD 4.43 million in H1 FY24, primarily due to increased exploration and corporate expenses. The company reported interest income of AUD 0.16 million, consistent with the prior year. Its balance sheet remained healthy, supported by a AU$25 million capital raise during the period, resulting in cash and equivalents of AU$32.6 million and minimal liabilities.
In a nutshell, H1 FY25 results reflect a company in aggressive growth and development mode, with a clear focus on expanding and de-risking its uranium resource base. The increased loss is expected at this stage, given the heavy investment in exploration and project advancement. The company is well-funded to execute its planned activities in 2025.
The recent clarification of JORC compliance for U-pgrade™ ore samples (released on 4 April 2025) underscores the company’s commitment to technical rigor in advancing its proprietary beneficiation process. This process aims to upgrade low-grade uranium ore into high-grade concentrates, potentially reducing production costs and improving project economics.
EL8’s Technical Analysis:
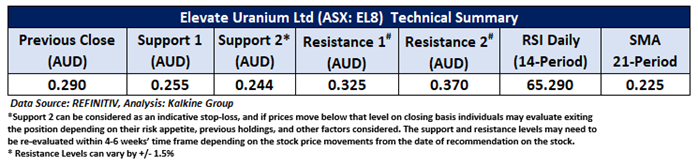
On the daily chart, EL8 is holding above a falling trendline support zone, indicating a potential shift in momentum. The 14-period Relative Strength Index (RSI) stands at approximately 65.29, suggesting a neutral-to-bullish sentiment with increasing buying interest. Additionally, the stock is trading above the 21-period Simple Moving Average (SMA), a key trend-following indicator that now acts as dynamic support, reinforcing the current bullish bias. Key levels to monitor include strong support at AUD 0.255 and overhead resistance at AUD 0.325.

Daily Technical Chart – EL8
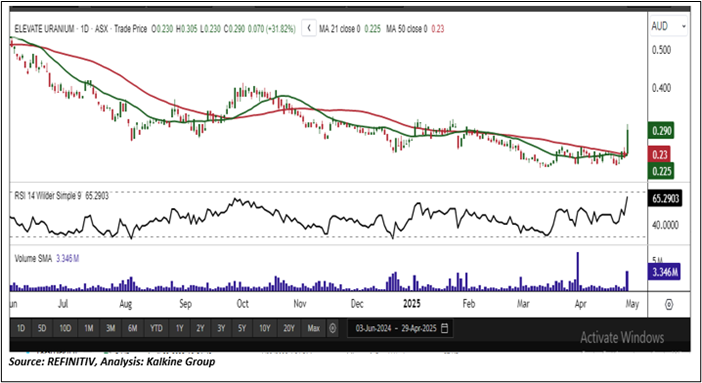
Considering the stock’s current price levels are trading above the falling trendline support zone, and momentum oscillator analysis, a “Speculative Buy” recommendation is given on the stock. The stock was analysed as per the closing price of AUD 0.290 per share as on 29 April 2025, up by 31.82%. Elevate Uranium Ltd (ASX: EL8) was last covered in a report dated ’14 September 2023’.
Note 1: Past performance is neither an Indicator nor a guarantee of future performance.
Note 2: Investment decision should be made depending on an individual’s appetite for upside potential, risks, and any previous holdings. This recommendation is purely based on technical analysis, and fundamental analysis has not been considered in this report.
Note 3: Related Risks: This report may be looked at from high-risk perspective and recommendations are provided are for a short duration. Recommendations provided in this report are solely based on technical parameters, and the fundamental performance of the stocks has not been considered in the decision-making process. Other factors which could impact the stock prices include market risks, regulatory risks, interest rates risks, currency risks, social and political instability risks etc.
The reference date for all price data, currency, technical indicators, support, and resistance levels is April 29, 2025. The reference data in this report has been partly sourced from REFINITIV.
Technical Indicators Defined:
Support: A level at which the stock prices tend to find support if they are falling, and a downtrend may take a pause backed by demand or buying interest. Support 1 refers to the nearby support level for the stock and if the price breaches the level, then Support 2 may act as the crucial support level for the stock.
Resistance: A level at which the stock prices tend to find resistance when they are rising, and an uptrend may take a pause due to profit booking or selling interest. Resistance 1 refers to the nearby resistance level for the stock and if the price surpasses the level, then Resistance 2 may act as the crucial resistance level for the stock.
Stop-loss: It is a level to protect further losses in case of unfavourable movement in the stock prices.
The Green colour line reflects the 21-period moving average. SMA helps to identify existing price trends. If the prices are trading above the 21-period, prices are currently in a bullish trend (Vice – Versa).
The Blue colour line reflects the 50-period moving average. SMA helps to identify existing price trends. If the prices are trading above the 50-period, prices are currently in a bullish trend (Vice – Versa).
The Orange/ Yellow colour line represents the Trendline.
The Purple colour line in the chart’s lower segment reflects the Relative Strength Index (14-Period), which indicates price momentum and signals momentum in trend. A reading of 70 or above suggests overbought status, while a reading of 30 or below suggests an oversold status.

 Please wait processing your request...