Company Overview: Ampol Limited (ASX: ALD) is a leading Australian energy company engaged in the refining, importing, and marketing of fuels and lubricants. The company holds a key position in the country’s transport energy infrastructure, supplying a broad range of essential petroleum products to retail consumers through its nationwide service station network, as well as to commercial and industrial clients. This Report covers the Price Action, Technical Indicators Analysis along with the Support Levels, Resistance Levels, and Recommendations on this stock.
1QFY25 Results Update: In the first quarter of 2025, total Group sales volume declined by 7.4% to 6,144 million litres (ML), compared to 6,636 ML in the same period last year. Convenience Retail volumes fell by 4.9% to 867 ML, while Australian wholesale volumes saw a modest increase of 1.0%, reaching 2,839 ML. As a result, total Australian volumes remained relatively stable, dipping slightly by 0.5% to 3,706 ML. International volumes (excluding New Zealand) dropped significantly by 26% to 1,443 ML. In contrast, the New Zealand market experienced a 3.2% rise in volumes, reaching 996 ML.
Growth Catalysts: ALD is progressing well with its productivity program, targeting AUD 50 million in nominal cost reductions by 2025, with gains anticipated in the second half of the year. In the quarter, the company also completed the divestment of its stake in Channel Infrastructure, generating around AUD 85 million in cash. This move highlights the ongoing benefits of the 2022 Z Energy acquisition and further strengthens the company’s balance sheet.
ALD’s Technical Analysis:
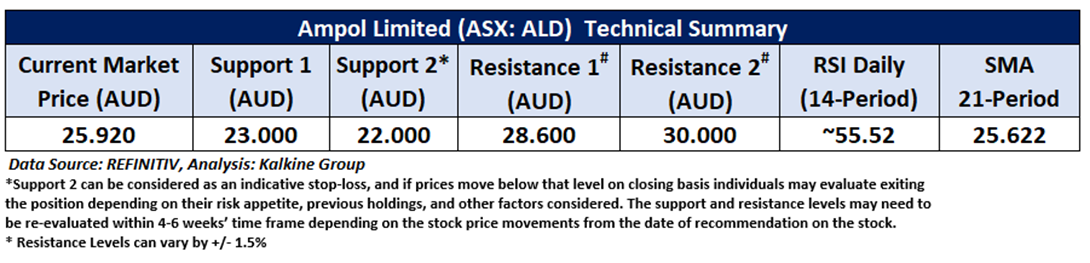
On the daily chart, ALD is trading above its horizontal trendline support, indicating price stability. The 14-period Relative Strength Index (RSI) is at 55.52, reflecting positive momentum. The stock also remains above its 50-period Simple Moving Average (SMA), which continues to act as dynamic support. Key price levels include critical support at AUD 23.00 and major resistance at AUD 28.60.

Daily Technical Chart – ALD
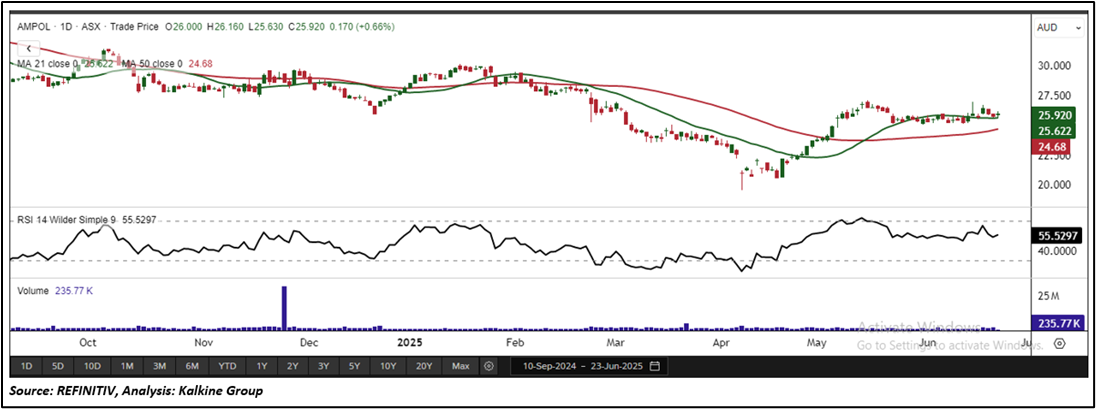
Considering the stock’s current price levels are trading above the horizontal trendline support, and momentum oscillator analysis, a “Speculative Buy” recommendation is given on the stock. The stock was analysed as per the current market price of AUD 25.92 per share as on 23 June 2025 at 01:12 PM AEST, up by 0.66%.
Note 1: Past performance is neither an Indicator nor a guarantee of future performance.
Note 2: Investment decision should be made depending on an individual’s appetite for upside potential, risks, and any previous holdings. This recommendation is purely based on technical analysis, and fundamental analysis has not been considered in this report.
Note 3: Related Risks: This report may be looked at from high-risk perspective and recommendations are provided are for a short duration. Recommendations provided in this report are solely based on technical parameters, and the fundamental performance of the stocks has not been considered in the decision-making process. Other factors which could impact the stock prices include market risks, regulatory risks, interest rates risks, currency risks, social and political instability risks etc.
The reference date for all price data, currency, technical indicators, support, and resistance levels is June 23, 2025. The reference data in this report has been partly sourced from REFINITIV.
Technical Indicators Defined:
Support: A level at which the stock prices tend to find support if they are falling, and a downtrend may take a pause backed by demand or buying interest. Support 1 refers to the nearby support level for the stock and if the price breaches the level, then Support 2 may act as the crucial support level for the stock.
Resistance: A level at which the stock prices tend to find resistance when they are rising, and an uptrend may take a pause due to profit booking or selling interest. Resistance 1 refers to the nearby resistance level for the stock and if the price surpasses the level, then Resistance 2 may act as the crucial resistance level for the stock.
Stop-loss: It is a level to protect further losses in case of unfavourable movement in the stock prices.
The Green colour line reflects the 21-period moving average. SMA helps to identify existing price trends. If the prices are trading above the 21-period, prices are currently in a bullish trend (Vice – Versa).
The Blue colour line reflects the 50-period moving average. SMA helps to identify existing price trends. If the prices are trading above the 50-period, prices are currently in a bullish trend (Vice – Versa).
The Orange/ Yellow colour line represents the Trendline.
The Purple colour line in the chart’s lower segment reflects the Relative Strength Index (14-Period), which indicates price momentum and signals momentum in trend. A reading of 70 or above suggests overbought status, while a reading of 30 or below suggests an oversold status.
_06_23_2025_03_51_20_847717.jpg)
 Please wait processing your request...