Company Overview: Guzman y Gomez Ltd (ASX: GYG) is a publicly listed Quick Service Restaurant (QSR) company offering clean, fresh, and made-to-order Mexican-inspired cuisine. Since launching its first restaurant in Sydney in 2006, GYG has rapidly grown its footprint to 210 locations across four countries. This Report covers the Price Action, Technical Indicators Analysis along with the Support Levels, Resistance Levels, and Recommendations on this stock.
Q3 FY25 Update (for the period from 1 January to 31 March 2025)
On 8 April 2025, GYG reported continued growth in network sales and ongoing expansion of its restaurant footprint. Total network sales reached AU$289.5 million, an increase of 23.6% compared to the same period last year. The Australian segment contributed AU$267.6 million, while Singapore, Japan, and the US also recorded year-on-year increases. Comparable sales in Australia grew by 11.1%, supported by performance across all sales channels, time-of-day segments, restaurant formats, and ownership types.
During the quarter, GYG opened five new restaurants—three in Australia and two in the US—bringing its global restaurant count to 241. In the US, sales growth was largely driven by the opening of new restaurants, while guest experience indicators improved as a result of targeted investments in restaurant labour. GYG reaffirmed its FY25 guidance for the Australian segment, which includes opening 31 new restaurants (13 corporate and 18 franchised), achieving corporate restaurant margins of approximately 17.8%, maintaining a franchise royalty rate of 8.3%, and keeping general and administrative costs at 6.7% of network sales. The company expects to exceed its FY25 NPAT forecast set out in the prospectus.
GYG also announced the introduction of a dividend policy, supported by its balance sheet position and cash flow generation. The policy takes into account future capital needs, operational performance, and available franking credits, with the expectation that most earnings will be distributed to shareholders while allowing flexibility for continued investment. The Board plans to implement the policy following the finalisation of the FY25 results, with the company’s first dividend expected to be paid in September 2025. More information will be shared with the release of the full-year results.
GYG’s Technical Analysis:
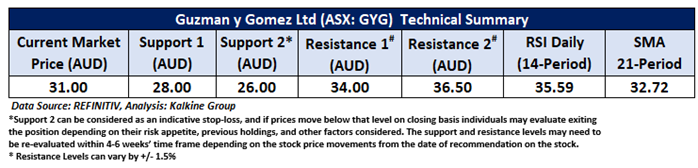
On the daily chart, GYG is exhibiting price stability, holding above a key falling trendline support level a sign of potential trend reversal or continued consolidation. The 14-period Relative Strength Index (RSI) is at 35.49, indicating building bullish momentum despite recent softness in price action. However, the stock remains below the 21-period Simple Moving Average (SMA), which continues to act as dynamic resistance. Key levels to monitor include crucial support at AUD 28.00 and major resistance at AUD 34.00.

Daily Technical Chart – GYG
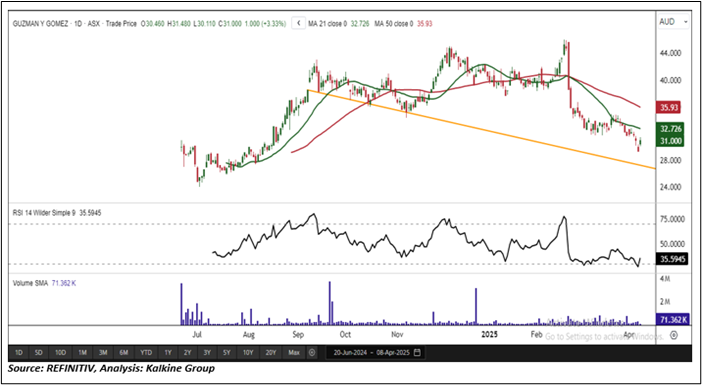
Considering the stock’s current price levels are trading above the falling trendline support, and momentum oscillator analysis, a “Speculative Buy” recommendation is given on the stock. The stock was analysed as per the current price of AUD 31.00 per share as on 08 April 2025 at 01:05 PM AEST, up by 3.33% . Guzman y Gomez Ltd (ASX: GYG) was last covered in a report dated ’25 June 2024’.
Note 1: Past performance is neither an Indicator nor a guarantee of future performance.
Note 2: Investment decision should be made depending on an individual’s appetite for upside potential, risks, and any previous holdings. This recommendation is purely based on technical analysis, and fundamental analysis has not been considered in this report.
Note 3: Related Risks: This report may be looked at from high-risk perspective and recommendations are provided are for a short duration. Recommendations provided in this report are solely based on technical parameters, and the fundamental performance of the stocks has not been considered in the decision-making process. Other factors which could impact the stock prices include market risks, regulatory risks, interest rates risks, currency risks, social and political instability risks etc.
The reference date for all price data, currency, technical indicators, support, and resistance levels is April 08, 2025. The reference data in this report has been partly sourced from REFINITIV.
Technical Indicators Defined:
Support: A level at which the stock prices tend to find support if they are falling, and a downtrend may take a pause backed by demand or buying interest. Support 1 refers to the nearby support level for the stock and if the price breaches the level, then Support 2 may act as the crucial support level for the stock.
Resistance: A level at which the stock prices tend to find resistance when they are rising, and an uptrend may take a pause due to profit booking or selling interest. Resistance 1 refers to the nearby resistance level for the stock and if the price surpasses the level, then Resistance 2 may act as the crucial resistance level for the stock.
Stop-loss: It is a level to protect further losses in case of unfavourable movement in the stock prices.
The Green colour line reflects the 21-period moving average. SMA helps to identify existing price trends. If the prices are trading above the 21-period, prices are currently in a bullish trend (Vice – Versa).
The Blue colour line reflects the 50-period moving average. SMA helps to identify existing price trends. If the prices are trading above the 50-period, prices are currently in a bullish trend (Vice – Versa).
The Orange/ Yellow colour line represents the Trendline.
The Purple colour line in the chart’s lower segment reflects the Relative Strength Index (14-Period), which indicates price momentum and signals momentum in trend. A reading of 70 or above suggests overbought status, while a reading of 30 or below suggests an oversold status.

 Please wait processing your request...