Company Overview: DroneShield Limited (ASX: DRO) is an Australian-based defence technology company that specializes in counter-drone and electronic warfare solutions. The company develops advanced hardware and software systems designed to detect, track, and neutralize unmanned aerial systems (UAS), protecting critical infrastructure, military operations, and civilian spaces from emerging drone threats. This Report covers the Price Action, Technical Indicators Analysis along with the Support Levels, Resistance Levels, and Recommendations on this stock.
FY24 earnings and business outlook:
In FY24, DroneShield reported a 6.4% year-over-year revenue increase to AU$57.5 million, driven by heightened global demand for counter-drone technologies. Despite this growth, the company faced an EBITDA loss of AU$8.6 million, attributed to scaling challenges and increased operating expenses. Notably, Software-as-a-Service (SaaS) revenue doubled to AU$2.8 million, highlighting a strategic shift towards recurring income streams. Looking ahead, DroneShield has secured AU$52 million in contracted revenue for FY25 and boasts a sales pipeline valued at AU$1.2 billion, positioning the company for accelerated growth in the counter-UAS market.
DRO’s Technical Analysis:
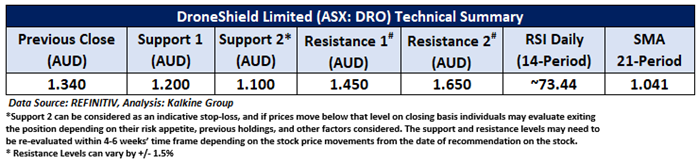
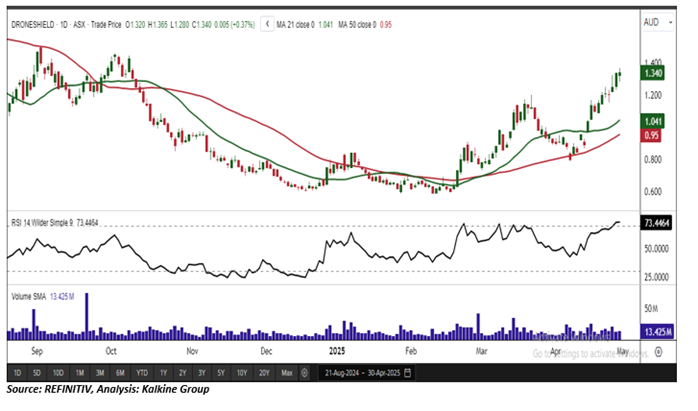
On the daily chart, DRO's stock price broke above its previous peak during an uptrend, indicating a positive bias. Additionally, the RSI (14-period) is heading north from the midpoint, providing further support for the mentioned recommendation. Prices are trading above both the 21-period and 50-day SMAs, which may potentially function as dynamic support levels for the stock; in contrast, the high in March 2024 might act as a resistance level. Crucial support for the stock is positioned at AUD 1.200, while key resistance is placed at AUD 1.450.

Daily Technical Chart – DRO
Considering the stock’s current price levels breaking its previous peak during an uptrend, and momentum oscillator analysis, a “Speculative Buy” recommendation is given on the stock. The stock was analysed as per the closing price of AUD 1.340 per share as on 30 April 2025, up by 0.37%. DroneShield Limited (ASX: DRO) was last covered in a report dated ’07 March 2025’.
Note 1: Past performance is neither an Indicator nor a guarantee of future performance.
Note 2: Investment decision should be made depending on an individual’s appetite for upside potential, risks, and any previous holdings. This recommendation is purely based on technical analysis, and fundamental analysis has not been considered in this report.
Note 3: Related Risks: This report may be looked at from high-risk perspective and recommendations are provided are for a short duration. Recommendations provided in this report are solely based on technical parameters, and the fundamental performance of the stocks has not been considered in the decision-making process. Other factors which could impact the stock prices include market risks, regulatory risks, interest rates risks, currency risks, social and political instability risks etc.
The reference date for all price data, currency, technical indicators, support, and resistance levels is April 30, 2025. The reference data in this report has been partly sourced from REFINITIV.
Technical Indicators Defined:
Support: A level at which the stock prices tend to find support if they are falling, and a downtrend may take a pause backed by demand or buying interest. Support 1 refers to the nearby support level for the stock and if the price breaches the level, then Support 2 may act as the crucial support level for the stock.
Resistance: A level at which the stock prices tend to find resistance when they are rising, and an uptrend may take a pause due to profit booking or selling interest. Resistance 1 refers to the nearby resistance level for the stock and if the price surpasses the level, then Resistance 2 may act as the crucial resistance level for the stock.
Stop-loss: It is a level to protect further losses in case of unfavourable movement in the stock prices.
The Green colour line reflects the 21-period moving average. SMA helps to identify existing price trends. If the prices are trading above the 21-period, prices are currently in a bullish trend (Vice – Versa).
The Blue colour line reflects the 50-period moving average. SMA helps to identify existing price trends. If the prices are trading above the 50-period, prices are currently in a bullish trend (Vice – Versa).
The Orange/ Yellow colour line represents the Trendline.
The Purple colour line in the chart’s lower segment reflects the Relative Strength Index (14-Period), which indicates price momentum and signals momentum in trend. A reading of 70 or above suggests overbought status, while a reading of 30 or below suggests an oversold status.

 Please wait processing your request...