Company Overview: DroneShield Limited (ASX: DRO) specialises in the development and commercialization of counter-drone technologies. DRO delivers counter-UAS solutions leveraging Radio Frequency (RF) sensing, Artificial Intelligence (AI) and Machine Learning (ML), sensor fusion, electronic warfare, rapid prototyping, and MIL-SPEC-grade manufacturing. The company's offerings cater to defense, government, and commercial clients worldwide. This Report covers the Price Action, Technical Indicators Analysis along with the Support Levels, Resistance Levels, and Recommendations on this stock.
DRO’s Technical Analysis:
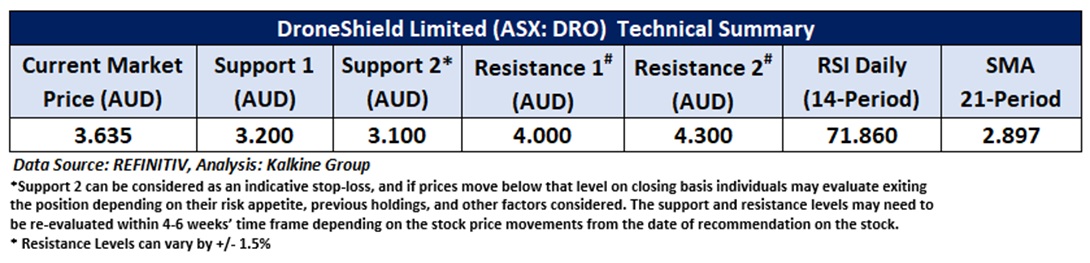
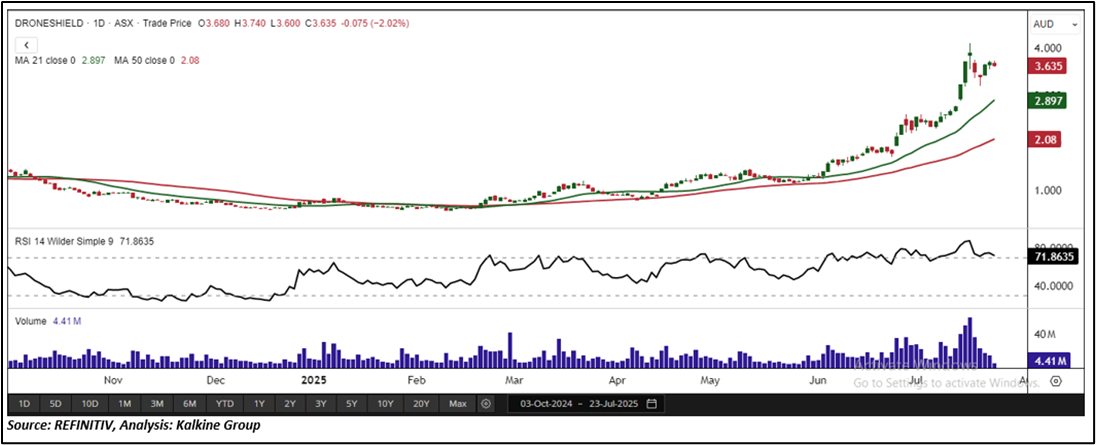
On the daily chart, DRO stock is trading above rising trendline support, suggesting the potential for continued upward momentum. The 14-period Relative Strength Index (RSI) is currently around 71.86, reflecting robust buying strength, although it is approaching overbought levels. Moreover, the price is holding above the 21-period Simple Moving Average (SMA), a key trend-following indicator that reinforces the prevailing bullish sentiment. Crucial support for the stock is positioned at AUD 3.20, while key resistance is placed at AUD 4.00.

Daily Technical Chart – DRO
Considering the stock’s current prices are trading above the rising trendline support, and momentum oscillator analysis, a “Speculative Buy” recommendation is given on the stock. The stock was analysed as per the current price of AUD 3.635 per share as on July 23, 2025, at 1:25 PM AEST.
Note 1: Past performance is neither an Indicator nor a guarantee of future performance.
Note 2: Investment decision should be made depending on an individual’s appetite for upside potential, risks, and any previous holdings. This recommendation is purely based on technical analysis, and fundamental analysis has not been considered in this report.
Note 3: Related Risks: This report may be looked at from high-risk perspective and recommendations are provided are for a short duration. Recommendations provided in this report are solely based on technical parameters, and the fundamental performance of the stocks has not been considered in the decision-making process. Other factors which could impact the stock prices include market risks, regulatory risks, interest rates risks, currency risks, social and political instability risks etc.
The reference date for all price data, currency, technical indicators, support, and resistance levels is July 23, 2025. The reference data in this report has been partly sourced from REFINITIV.
Technical Indicators Defined:
Support: A level at which the stock prices tend to find support if they are falling, and a downtrend may take a pause backed by demand or buying interest. Support 1 refers to the nearby support level for the stock and if the price breaches the level, then Support 2 may act as the crucial support level for the stock.
Resistance: A level at which the stock prices tend to find resistance when they are rising, and an uptrend may take a pause due to profit booking or selling interest. Resistance 1 refers to the nearby resistance level for the stock and if the price surpasses the level, then Resistance 2 may act as the crucial resistance level for the stock.
Stop-loss: It is a level to protect further losses in case of unfavourable movement in the stock prices.
The Green colour line reflects the 21-period moving average. SMA helps to identify existing price trends. If the prices are trading above the 21-period, prices are currently in a bullish trend (Vice – Versa).
The Blue colour line reflects the 50-period moving average. SMA helps to identify existing price trends. If the prices are trading above the 50-period, prices are currently in a bullish trend (Vice – Versa).
The Orange/ Yellow colour line represents the Trendline.
The Purple colour line in the chart’s lower segment reflects the Relative Strength Index (14-Period), which indicates price momentum and signals momentum in trend. A reading of 70 or above suggests overbought status, while a reading of 30 or below suggests an oversold status.

 Please wait processing your request...