Company Overview: Austal Limited (ASX: ASB) is an Australia-based global shipbuilder and defence prime contractor. The company provides ships, systems, and support services for naval forces, government agencies, and commercial operators. Austal designs, builds, and supports a wide range of commercial vessels, including passenger ferries, vehicle-passenger ferries, offshore support ships, and windfarm service vessels for operators worldwide. This Report covers the Price Action, Technical Indicators Analysis along with the Support Levels, Resistance Levels, and Recommendations on this stock.
Key Recent Update:
On 10 June 2025, ASB, Australia's leading global shipbuilder and defence prime contractor, recently announced an update regarding its substantial shareholder Hanwha Group's regulatory approvals. Hanwha has claimed to have received approval from the U.S. Committee on Foreign Investment (CFIUS) to increase its equity holding in Austal up to 100 percent; however, Austal is seeking written confirmation as initial informal discussions suggest the approval may differ from Hanwha's claim. Currently, Hanwha holds a 9.9% equity stake and an additional 9.9% economic interest through a total return swap, with an application pending before Australia's Foreign Investment Review Board (FIRB) to increase its stake to 19.9%. The final extent of foreign ownership will be subject to FIRB's recommendation and the Australian Treasurer's decision.
H1 FY25 Financial Highlights (for the six months ended 31 December 2024, released on 21 February 2025)
- Austal Limited reported H1 FY2025 results with revenue of AUD 825.7 million, up 15.1% from AUD 717.7 million in H1 FY2024, driven by increased shipbuilding activity in the USA and a recovery in Australasian operations. EBIT rose 33% to AUD 42.7 million, improving the margin to 5.2% from 4.5%, while net profit after tax more than doubled to AUD 25.1 million.
- The company’s net cash position strengthened to AUD 212.6 million, supported by two major infrastructure contracts totaling approximately USD 600 million aimed at expanding Austal USA’s shipyard capacity to support US Navy submarine programs.
- Austal also reported a record order book of AUD 14.2 billion, reflecting continued growth and a positive outlook for the full year EBIT guidance of at least AUD 80 million.
ASB’s Technical Analysis:
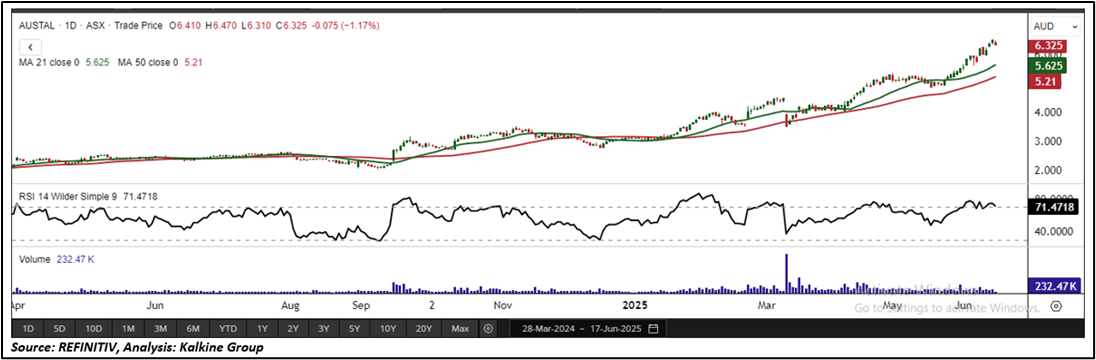
On the daily chart, ASB is showing bullish technical signals. The stock is trading above rising trendline support, suggesting the potential for continued upward momentum. The 14-period Relative Strength Index (RSI) is currently around 71.47, reflecting robust buying strength, although it is approaching overbought levels. Moreover, the price is holding above the 21-period Simple Moving Average (SMA), a key trend-following indicator that reinforces the prevailing bullish sentiment. Crucial support for the stock is positioned at AUD 5.60, while key resistance is placed at AUD 7.00.
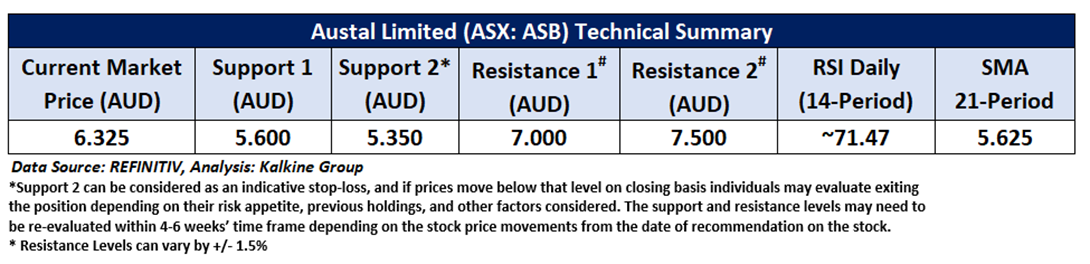

Daily Technical Chart – ASB
Considering the stock’s current prices are trading above the rising trendline support, and momentum oscillator analysis, a “Speculative Buy” recommendation is given on the stock. The stock was analysed as per the current price of AUD 6.325 per share as on June 17, 2025, at 11:45 AM AEST.
Note 1: Past performance is neither an Indicator nor a guarantee of future performance.
Note 2: Investment decision should be made depending on an individual’s appetite for upside potential, risks, and any previous holdings. This recommendation is purely based on technical analysis, and fundamental analysis has not been considered in this report.
Note 3: Related Risks: This report may be looked at from high-risk perspective and recommendations are provided are for a short duration. Recommendations provided in this report are solely based on technical parameters, and the fundamental performance of the stocks has not been considered in the decision-making process. Other factors which could impact the stock prices include market risks, regulatory risks, interest rates risks, currency risks, social and political instability risks etc.
The reference date for all price data, currency, technical indicators, support, and resistance levels is June 17, 2025. The reference data in this report has been partly sourced from REFINITIV.
Technical Indicators Defined:
Support: A level at which the stock prices tend to find support if they are falling, and a downtrend may take a pause backed by demand or buying interest. Support 1 refers to the nearby support level for the stock and if the price breaches the level, then Support 2 may act as the crucial support level for the stock.
Resistance: A level at which the stock prices tend to find resistance when they are rising, and an uptrend may take a pause due to profit booking or selling interest. Resistance 1 refers to the nearby resistance level for the stock and if the price surpasses the level, then Resistance 2 may act as the crucial resistance level for the stock.
Stop-loss: It is a level to protect further losses in case of unfavourable movement in the stock prices.
The Green colour line reflects the 21-period moving average. SMA helps to identify existing price trends. If the prices are trading above the 21-period, prices are currently in a bullish trend (Vice – Versa).
The Blue colour line reflects the 50-period moving average. SMA helps to identify existing price trends. If the prices are trading above the 50-period, prices are currently in a bullish trend (Vice – Versa).
The Orange/ Yellow colour line represents the Trendline.
The Purple colour line in the chart’s lower segment reflects the Relative Strength Index (14-Period), which indicates price momentum and signals momentum in trend. A reading of 70 or above suggests overbought status, while a reading of 30 or below suggests an oversold status.

 Please wait processing your request...