Company Overview: PYC Therapeutics Limited (ASX: PYC) is an Australia-based clinical-stage biotechnology company creating a new generation of ribonucleic acid (RNA) therapies to change the lives of patients with genetic diseases. The company utilizes its proprietary drug delivery platform to enhance the potency of precision medicines within the rapidly growing and commercially proven RNA therapeutic class. This Report covers the Price Action, Technical Indicators Analysis along with the Support Levels, Resistance Levels, and Recommendations on these stocks.
PYC Q1 2025 Update: PYC has provided a Q1 2025 update, confirming steady progress toward its strategic goals. The company remains on track with its operational roadmap and recently completed a AUD 146 million Entitlement Offer, extending its cash runway to over AUD 200 million. This funding supports key human data readouts across PYC’s pipeline of three first-in-class, clinical-stage drug candidates. The primary focus is now on delivering clinical proof-of-concept for each candidate within this runway, starting with the Phase 1/2 data presentation for its lead therapy targeting blinding eye disease, scheduled for May 2025.
Recent Update: The company is advancing PYC-003, a novel drug candidate targeting the root cause of Polycystic Kidney Disease (PKD), a condition affecting millions with no current treatment options. The c has dosed the first subject in its Phase 1a clinical trial. If early results are positive, PYC-003 could move swiftly toward approval via a single combined Phase 2/3 registrational study following the current Phase 1a/1b trial.
PYC’s Technical Analysis:
PYC’s stock is currently displaying an uptrend on the daily chart, characterized by a series of higher highs and higher lows, reflecting ongoing bullish sentiment. The 14-period RSI has climbed from oversold territory and stabilises around the midpoint, reinforcing the positive momentum. Despite this, the stock is trading below both the 21-period and 50-day simple moving averages, which may serve as dynamic resistance in the near term. On the downside, the next round number is acting as a sentimental support level. Key support lies at AUD 0.83, while resistance is identified at AUD 1.38.


Daily Technical Chart – PYC
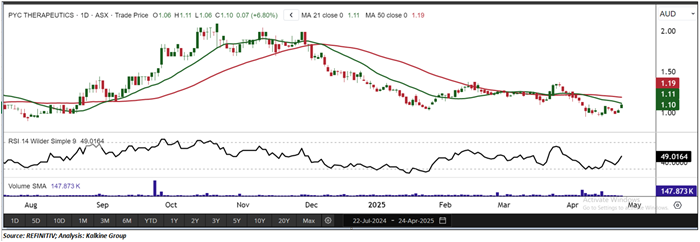
Considering the stock’s current price levels forming higher peaks and higher troughs, and momentum oscillator analysis, a “Speculative Buy” recommendation is given on the stock. The stock was analysed as per the Current Market Price of AUD 1.10 per share, up by 6.80% as on 24 April 2025 at (12.39 PM AEST).
Individuals can evaluate the stock based on the support and resistance levels provided in the report in case of keen interest, taking into consideration the risk-reward scenario.
Note 1: Past performance is neither an Indicator nor a guarantee of future performance.
Note 2: Investment decision should be made depending on an individual’s appetite for upside potential, risks, and any previous holdings. This recommendation is purely based on technical analysis, and fundamental analysis has not been considered in this report.
Note 3: Kalkine reports are prepared based on the stock prices captured either from REFINITIV or Trading View. Typically, REFINITIV or Trading View may reflect stock prices with a delay which could be a lag of 25-30 minutes. There can be no assurance that future results or events will be consistent with the information provided in the report. The information is subject to change without any prior notice.
Note 4: Related Risks: This report may be looked at from high-risk perspective and recommendations are provided are for a short duration. Recommendations provided in this report are solely based on technical parameters, and the fundamental performance of the stocks has not been considered in the decision-making process. Other factors which could impact the stock prices include market risks, regulatory risks, interest rates risks, currency risks, social and political instability risks etc.
The reference date for all price data, currency, technical indicators, support, and resistance levels is April 24, 2025. The reference data in this report has been partly sourced from REFINITIV.
Technical Indicators Defined:
Support: A level at which the stock prices tend to find support if they are falling, and a downtrend may take a pause backed by demand or buying interest. Support 1 refers to the nearby support level for the stock and if the price breaches the level, then Support 2 may act as the crucial support level for the stock.
Resistance: A level at which the stock prices tend to find resistance when they are rising, and an uptrend may take a pause due to profit booking or selling interest. Resistance 1 refers to the nearby resistance level for the stock and if the price surpasses the level, then Resistance 2 may act as the crucial resistance level for the stock.
Stop-loss: It is a level to protect further losses in case of unfavourable movement in the stock prices.
The Green colour line reflects the 21-period moving average. SMA helps to identify existing price trends. If the prices are trading above the 21-period, prices are currently in a bullish trend (Vice – Versa).
The Blue colour line reflects the 50-period moving average. SMA helps to identify existing price trends. If the prices are trading above the 50-period, prices are currently in a bullish trend (Vice – Versa).
The Orange/ Yellow colour line represents the Trendline.
The Purple colour line in the chart’s lower segment reflects the Relative Strength Index (14-Period), which indicates price momentum and signals momentum in trend. A reading of 70 or above suggests overbought status, while a reading of 30 or below suggests an oversold status.

 Please wait processing your request...