Company Overview: Mineral Resources Limited (ASX: MIN) operates as a mining services company in Australia, Asia, and internationally, offering contract crushing, screening, and processing; transport and logistics; site services; rehabilitation services; and design, engineering, and construction services for resources sector. This Report covers the Price Action, Technical Indicators Analysis along with the Support Levels, Resistance Levels, and Recommendations on this stock.
What’s Causing the Drop in Mineral Resources Shares?
Mineral Resources' shares are declining after a negative market reaction to a series of announcements. On November 4, 2024, the company revealed that its founder, Chris Ellison, would resign within 18 months due to an internal investigation that found he misused company resources and evaded taxes, including failing to report overseas business revenue to the Australian Taxation Office. Additionally, the company was questioned by the ASX about its compliance with listing rules regarding financial benefits to entities linked to Ellison. Mineral Resources disclosed AU$32.2 million in lease payments to these entities, admitting that some arrangements, such as rent relief for Ellison’s daughter, should have been disclosed earlier. These issues have contributed to further investor concerns and a significant decline in share price.
- Response to ASX Compliance Letter:
- On 14 November 2024, MinRes responded to the ASX regarding related-party financial transactions linked to Managing Director Chris Ellison. The update clarified rental payments and rent relief involving entities connected to Ellison and his daughter, as well as procedural improvements for related-party transactions. MinRes emphasized that these transactions were assessed as immaterial to recent financial statements and confirmed compliance with ASX listing rules. The Board is committed to maintaining transparency, with some inquiries still ongoing to meet disclosure requirements.
- Bald Hill Operations and Mineral Resources Update:
- On 13 November 2024, Mineral Resources Limited (MinRes) announced it will transition its Bald Hill lithium mine to care and maintenance due to prolonged low prices for spodumene concentrate. This measure will reduce costs and preserve mine’s value for future market improvement. Around 300 employees will be impacted, with redeployment efforts underway.
- Mineral Resources' share price dropped after announcing it would transition its Bald Hill lithium project into care and maintenance due to persistently low spodumene prices.
- When prices rebound, the company expects a quick restart. Positively, the updated resource estimate shows a 168% increase in Bald Hill’s lithium reserves, highlighting its long-term potential.
Conclusion
MinRes has seen a decline in its stock price this year, driven by a mix of falling commodity prices, leadership uncertainties, and concerns about the company's high debt levels.
- Commodity Price Exposure: The company’s earnings are heavily influenced by falling iron ore and lithium prices, with higher-cost operations making it more vulnerable to price declines.
- Management Uncertainty: Allegations against CEO Chris Ellison, along with his planned departure, have raised concerns about leadership changes impacting the company's operations.
- High Debt: MinRes has increased debt significantly, with a projected 4x debt-to-profit ratio, raising concerns over its financial stability if commodity prices drop further.
MIN’s Technical Analysis:
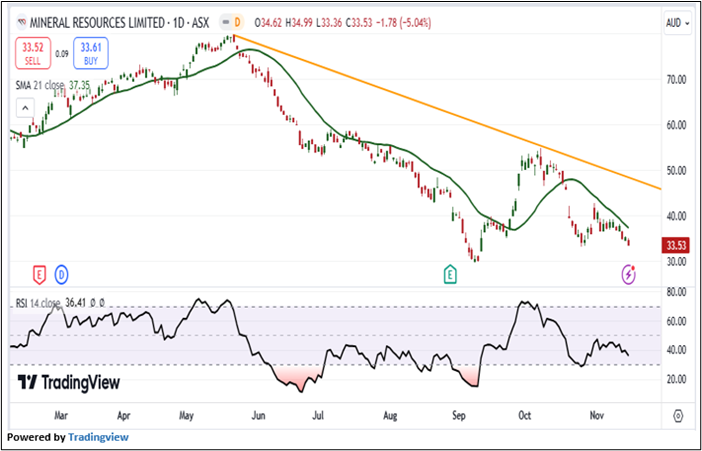
On the daily chart, MIN's stock price is undergoing a downtrend characterized by lower highs and lower lows, signalling a negative bias. Additionally, the RSI (14-period) is heading southward from the midpoint, providing further support for the mentioned recommendation. Prices are trading below both the 21-period and 50-day SMAs, which may potentially function as dynamic resistance levels for the stock; in contrast, the stock’s most recent low might act as a support level. Important support for the stock is positioned at AUD 29.51, while key resistance is placed at AUD 36.51.
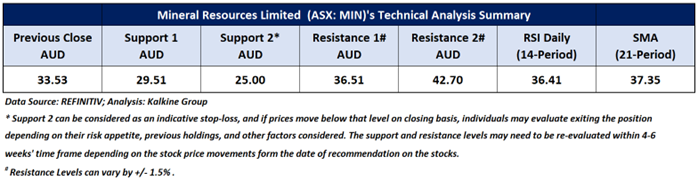
Daily Technical Chart – MIN
Individuals can evaluate the stock based on the support and resistance levels provided in the report in case of keen interest, taking into consideration the risk-reward scenario.
The stock was analysed as per the closing price of AUD 33.53 per share as on 15 November 2024, down by 5.04%. Mineral Resources Limited (ASX: MIN) was last covered in a report dated ’31 October 2024’.
Note 1: Past performance is neither an Indicator nor a guarantee of future performance.
Note 2: Investment decision should be made depending on an individual’s appetite for upside potential, risks, and any previous holdings. This recommendation is purely based on technical analysis, and fundamental analysis has not been considered in this report.
Note 3: Related Risks: This report may be looked at from high-risk perspective and recommendations are provided are for a short duration. Recommendations provided in this report are solely based on technical parameters, and the fundamental performance of the stocks has not been considered in the decision-making process. Other factors which could impact the stock prices include market risks, regulatory risks, interest rates risks, currency risks, social and political instability risks etc.
The reference date for all price data, currency, technical indicators, support, and resistance levels is November 15, 2024. The reference data in this report has been partly sourced from REFINITIV.
Technical Indicators Defined:
Support: A level at which the stock prices tend to find support if they are falling, and a downtrend may take a pause backed by demand or buying interest. Support 1 refers to the nearby support level for the stock and if the price breaches the level, then Support 2 may act as the crucial support level for the stock.
Resistance: A level at which the stock prices tend to find resistance when they are rising, and an uptrend may take a pause due to profit booking or selling interest. Resistance 1 refers to the nearby resistance level for the stock and if the price surpasses the level, then Resistance 2 may act as the crucial resistance level for the stock.
Stop-loss: It is a level to protect further losses in case of unfavourable movement in the stock prices.
The Green colour line reflects the 21-period moving average. SMA helps to identify existing price trends. If the prices are trading above the 21-period, prices are currently in a bullish trend (Vice – Versa).
The Blue colour line reflects the 50-period moving average. SMA helps to identify existing price trends. If the prices are trading above the 50-period, prices are currently in a bullish trend (Vice – Versa).
The Orange/ Yellow colour line represents the Trendline.
The Purple colour line in the chart’s lower segment reflects the Relative Strength Index (14-Period), which indicates price momentum and signals momentum in trend. A reading of 70 or above suggests overbought status, while a reading of 30 or below suggests an oversold status.
 Please wait processing your request...