Company Overview: Kairos Minerals Limited (ASX: KAI) is a resource exploration company focused on the discovery and development of gold, rare earth elements, and lithium projects. The company’s primary exploration activities are centered in the Pilbara region of Western Australia, particularly south of Port Hedland an area known for its rich mineral potential. This Report covers the Price Action, Technical Indicators Analysis along with the Support Levels, Resistance Levels, and Recommendations on this stock.
Recent Updates:
Kairos Minerals Limited (ASX: KAI) is a gold exploration company with a significant presence in Western Australia, particularly through its Mt York Gold Project in the Pilbara region. The project hosts a substantial gold resource of 1.4 million ounces, largely contained in a single open pit with favorable metallurgy, which simplifies and reduces processing costs compared to peers like DEG. This metallurgical advantage is crucial as it enhances the project's economic viability by lowering operational expenses.
The Mt York project's scoping study demonstrates profitability, even with conservative assumptions. The study forecasts positive financial returns, including a net present value (NPV) of AU$410 million and an internal rate of return (IRR) of 35.7%. The project is expected to produce 657,200 ounces of gold over an 8-year mine life with all-in sustaining costs (AISC) of $2,205 per ounce. Kairos is planning a significant drilling program to expand resources and upgrade inferred resources.
Kairos is well-funded with over AU$12.39 million in cash and an additional AU$10 million expected from a deal with Pilbara Minerals, supporting an extensive drilling program aimed at expanding its resource base and upgrading inferred resources to support a pre-feasibility study. The upcoming 20,000–30,000 metre drilling program will target both resource expansion and resource category upgrades, focusing on the Main Hill extension, which offers significant growth potential.
Overall, Kairos Minerals presents a compelling investment opportunity given its undervaluation, project fundamentals, and upcoming strategic initiatives. The company's strategic position in the Pilbara region, combined with its favorable metallurgy and substantial resource base, positions it for significant growth in the gold exploration sector.
KAI’s Technical Analysis:
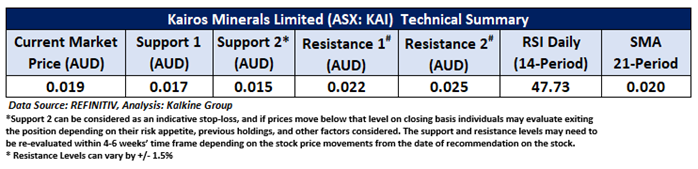
On the daily chart, KAI’s stock is exhibiting a clear uptrend, marked by a series of higher highs and higher lows signalling a positive market sentiment. During a brief pullback, the stock has shown resilience by rebounding from a key support level aligned with its previous trough. Currently, the price is consolidating within the range defined by its recent peak and trough, which now serve as potential resistance and support zones, respectively. Notably, crucial support is identified at AUD 0.017, while key resistance is situated at AUD 0.022.

Daily Technical Chart – KAI
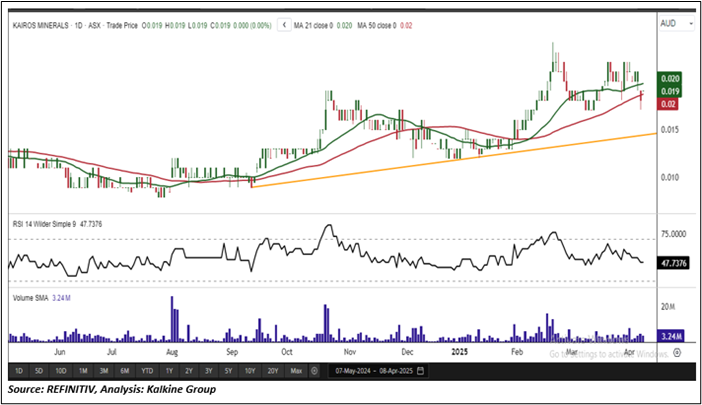
Considering the stock’s current price levels forming higher peaks and higher troughs, and momentum oscillator analysis, a “Speculative Buy” recommendation is given on the stock. The stock was analysed as per the current price of AUD 0.019 per share as on 08 April 2025 at 2:20 PM AEST. Kairos Minerals Limited (ASX: KAI) was last covered in a report dated ’05 March 2025’.
Note 1: Past performance is neither an Indicator nor a guarantee of future performance.
Note 2: Investment decision should be made depending on an individual’s appetite for upside potential, risks, and any previous holdings. This recommendation is purely based on technical analysis, and fundamental analysis has not been considered in this report.
Note 3: Related Risks: This report may be looked at from high-risk perspective and recommendations are provided are for a short duration. Recommendations provided in this report are solely based on technical parameters, and the fundamental performance of the stocks has not been considered in the decision-making process. Other factors which could impact the stock prices include market risks, regulatory risks, interest rates risks, currency risks, social and political instability risks etc.
The reference date for all price data, currency, technical indicators, support, and resistance levels is April 08, 2025. The reference data in this report has been partly sourced from REFINITIV.
Technical Indicators Defined:
Support: A level at which the stock prices tend to find support if they are falling, and a downtrend may take a pause backed by demand or buying interest. Support 1 refers to the nearby support level for the stock and if the price breaches the level, then Support 2 may act as the crucial support level for the stock.
Resistance: A level at which the stock prices tend to find resistance when they are rising, and an uptrend may take a pause due to profit booking or selling interest. Resistance 1 refers to the nearby resistance level for the stock and if the price surpasses the level, then Resistance 2 may act as the crucial resistance level for the stock.
Stop-loss: It is a level to protect further losses in case of unfavourable movement in the stock prices.
The Green colour line reflects the 21-period moving average. SMA helps to identify existing price trends. If the prices are trading above the 21-period, prices are currently in a bullish trend (Vice – Versa).
The Blue colour line reflects the 50-period moving average. SMA helps to identify existing price trends. If the prices are trading above the 50-period, prices are currently in a bullish trend (Vice – Versa).
The Orange/ Yellow colour line represents the Trendline.
The Purple colour line in the chart’s lower segment reflects the Relative Strength Index (14-Period), which indicates price momentum and signals momentum in trend. A reading of 70 or above suggests overbought status, while a reading of 30 or below suggests an oversold status.

 Please wait processing your request...