Company Overview: Ionic Rare Earths Limited (ASX: IXR) engages in the mining, refining, and recycling of magnet and heavy rare earth elements in Australia, Uganda, and United Kingdom. This Report covers the Price Action, Technical Indicators Analysis along with the Support Levels, Resistance Levels, and Recommendations on this stock.
Recent Updates:
- Based on the latest ASX announcement from 18 June 2025, Ionic Rare Earths Limited (ASX: IXR) is making strategic progress, particularly through its Viridion Joint Venture (JV) with Viridis Mining and Minerals Ltd. The JV is expanding its scope to include a potential US-based rare earth refinery, in addition to its Brazilian refining and magnet recycling facilities. This expansion aims to support a secure supply of magnets and heavy rare earth oxides (REOs) for the US manufacturing base, which currently relies heavily on imports from China.
- On 29 May 2025, Ionic Rare Earths Limited (ASX: IXR) announced it had secured firm commitments to raise $3.0 million before costs through the issue of convertible notes, subject to shareholder approval. The convertible notes will convert into shares either on the holder’s election or automatically on 15 June 2027 if not converted earlier. Conversion price is the lower of 0.9 cents per share or a 20% discount to the 15-day volume weighted average price prior to conversion, with a fixed 0.9 cents conversion price if converted before 22 September 2025.
Financial Update:
- The company is still in development and scoping phases; commercial production and revenue generation timelines may be several years away.
- Loss after income tax for H1 FY25 was AU$6.65 million, an improvement compared to AU$14.18 million loss in the prior corresponding period (H1 FY24)
- In summary, IXR remained a pre-revenue, development-stage company investing heavily in rare earth exploration, recycling technology, and refining projects. The financials reflect ongoing losses typical for this stage, supported by government grants and capital raisings.
IXR’s Technical Analysis:
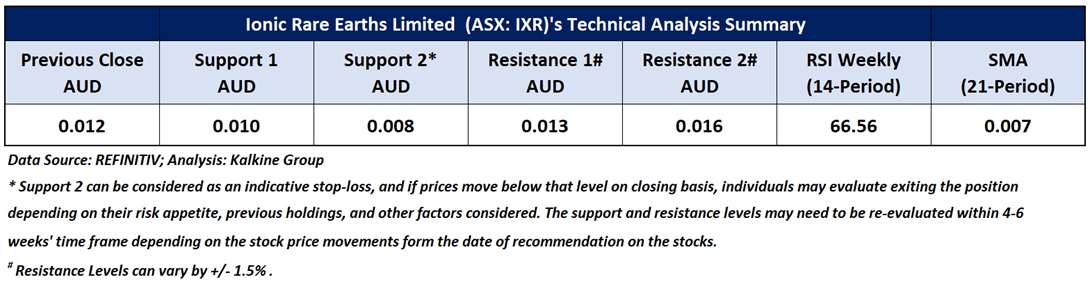
On the weekly chart, IXR's stock price surpassed its previous peak followed by a descending wedge pattern, signalling a positive trend. Additionally, after forming multiple bottom divergence in relations to prices, the RSI (14-period) is heading north from its midpoint, providing further support for the mentioned recommendation. Prices are trading above both the 21-period and 50-period SMAs, which may potentially function as dynamic support levels for the stock; in contrast, the low in August 2023 might act as a resistance level. Crucial support for the stock is positioned at AUD 0.010, while key resistance is placed at AUD 0.013.

Weekly Technical Chart – IXR
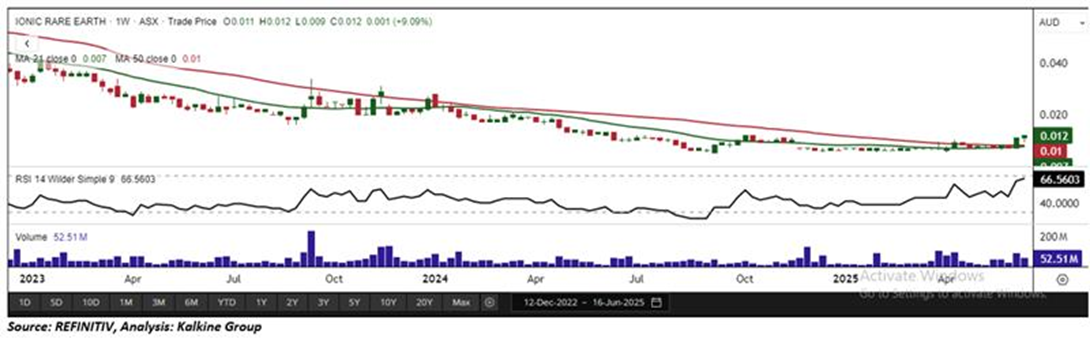
Considering the stock’s current price levels forming higher peaks and higher troughs, and momentum oscillator analysis, a “Speculative Buy” recommendation is given on the stock. The stock was analysed as per the closing price of AUD 0.012 per share as on 18 June 2025, up by 20.00%. Ionic Rare Earths Limited (ASX: IXR) was last covered in a report dated ’29 August 2023’.
Note 1: Past performance is neither an Indicator nor a guarantee of future performance.
Note 2: Investment decision should be made depending on an individual’s appetite for upside potential, risks, and any previous holdings. This recommendation is purely based on technical analysis, and fundamental analysis has not been considered in this report.
Note 3: Related Risks: This report may be looked at from high-risk perspective and recommendations are provided are for a short duration. Recommendations provided in this report are solely based on technical parameters, and the fundamental performance of the stocks has not been considered in the decision-making process. Other factors which could impact the stock prices include market risks, regulatory risks, interest rates risks, currency risks, social and political instability risks etc.
The reference date for all price data, currency, technical indicators, support, and resistance levels is June 18, 2025. The reference data in this report has been partly sourced from REFINITIV.
Technical Indicators Defined:
Support: A level at which the stock prices tend to find support if they are falling, and a downtrend may take a pause backed by demand or buying interest. Support 1 refers to the nearby support level for the stock and if the price breaches the level, then Support 2 may act as the crucial support level for the stock.
Resistance: A level at which the stock prices tend to find resistance when they are rising, and an uptrend may take a pause due to profit booking or selling interest. Resistance 1 refers to the nearby resistance level for the stock and if the price surpasses the level, then Resistance 2 may act as the crucial resistance level for the stock.
Stop-loss: It is a level to protect further losses in case of unfavourable movement in the stock prices.
The Green colour line reflects the 21-period moving average. SMA helps to identify existing price trends. If the prices are trading above the 21-period, prices are currently in a bullish trend (Vice – Versa).
The Blue colour line reflects the 50-period moving average. SMA helps to identify existing price trends. If the prices are trading above the 50-period, prices are currently in a bullish trend (Vice – Versa).
The Orange/ Yellow colour line represents the Trendline.
The Purple colour line in the chart’s lower segment reflects the Relative Strength Index (14-Period), which indicates price momentum and signals momentum in trend. A reading of 70 or above suggests overbought status, while a reading of 30 or below suggests an oversold status.
 Please wait processing your request...