Company Overview: Santa Fe Minerals Limited (ASX: SFM) is an Australia-based gold and base metals exploration company, including Mt Murray Base Metals, Challa North and Challa South Projects. Nanoveu Limited (ASX: NVU) specializes in protective films and coatings, including Nanoshield, Nanoshield Marine, Nanoshield Solar, EyeFly3D, Customskins and EyeFyx products. Island Pharmaceuticals Limited (ASX : ILA) is a drug repurposing company focused on developing drugs for viral infections. Raptis Group Limited (ASX: RPG) engages in property development management and investment, focusing on integrated residential, resort, retail, and commercial development. This Report covers the Price Action, Technical Indicators Analysis along with the Support Levels, Resistance Levels, and Recommendations on these stocks.
SFM’s Technical Analysis:
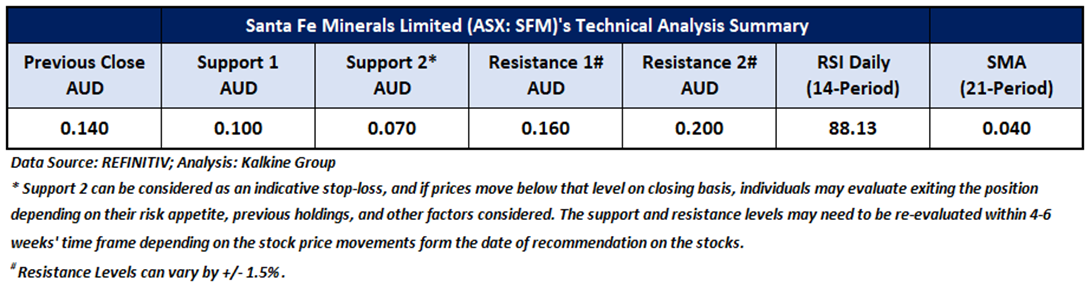
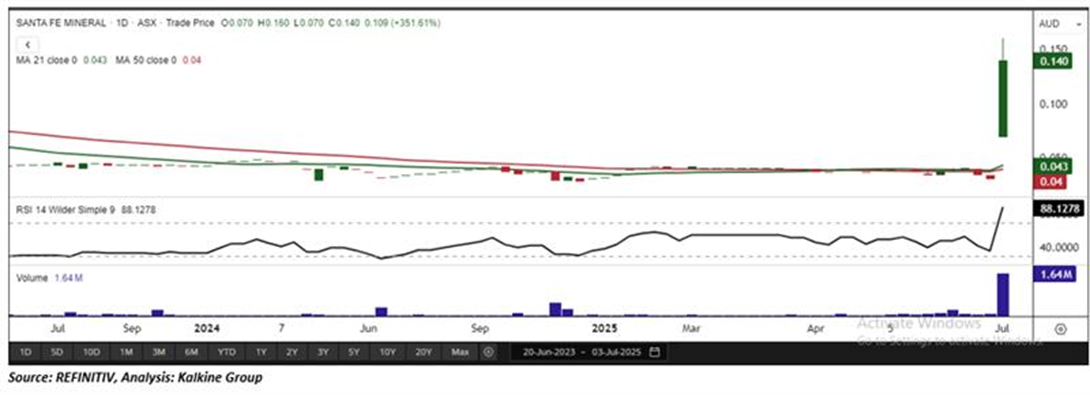
On the daily chart, SFM's stock price broke above its previous peak with a breakaway gap, indicating a positive bias. In contrast, after a strong increasing day, the stock is approaching the upper boundary of a descending wedge pattern established since May 2014, anticipating a potential correction. Prices are trading between its previous peak and trough, which may potentially function as resistance and support levels for the stocks, respectively. Critical support for the stock is positioned at AUD 0.100, while significant resistance is placed at AUD 0.160.
Daily Technical Chart – SFM
Individuals can evaluate the stock based on the support and resistance levels provided in the report in case of keen interest, taking into consideration the risk-reward scenario.
Considering the stock’s current price levels forming higher peaks and higher troughs, and momentum oscillator analysis, a “Watch” recommendation is given on the stock. The stock was analysed as per the closing price of AUD 0.140 per share as on 03 July 2025, up by 351.62%.
NVU’s Technical Analysis:
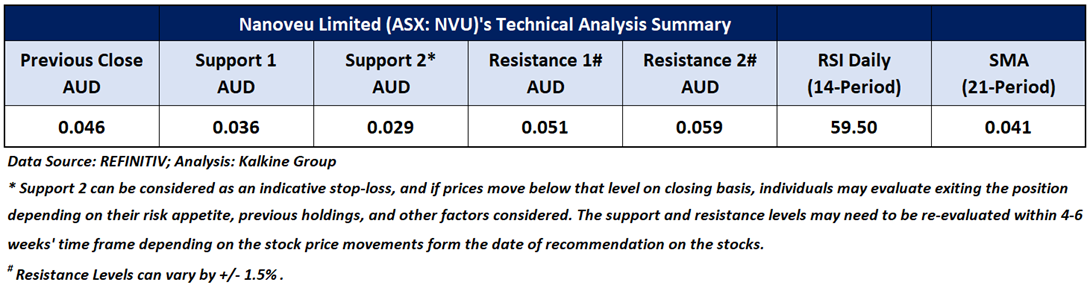
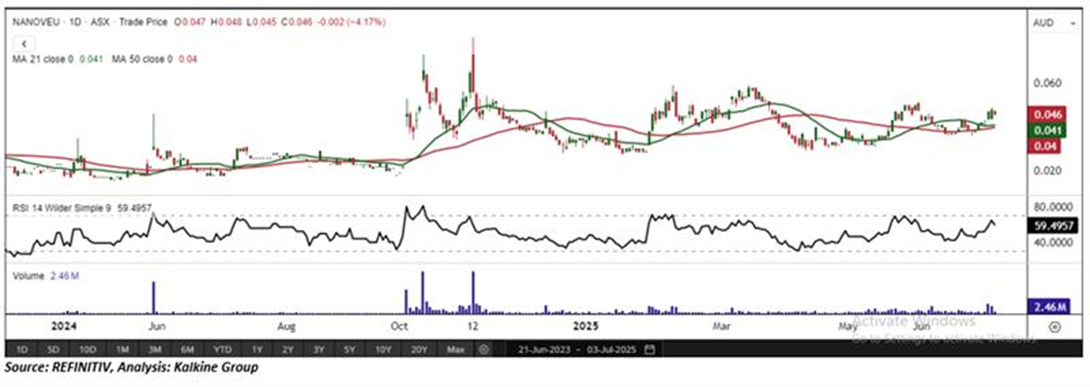
On the daily chart, NVU's stock price is forming a symmetrical triangle pattern, suggesting that the current sideways period in the stock might continue to persist in the near future. Additionally, the RSI (14-period) is fluctuating around its midpoint, adding more evidence to the previous observation. Prices are trading between its previous peak and trough, which may potentially function as resistance and support levels for the stocks, respectively. Critical support for the stock is positioned at AUD 0.036, while significant resistance is placed at AUD 0.051.
Daily Technical Chart – NVU
Individuals can evaluate the stock based on the support and resistance levels provided in the report in case of keen interest, taking into consideration the risk-reward scenario.
Considering the stock’s current price levels forming higher peaks and higher troughs, and momentum oscillator analysis, a “Watch” recommendation is given on the stock. The stock was analysed as per the closing price of AUD 0.046 per share as on 03 July 2025, down by 4.17%. Nanoveu Limited (ASX: NVU) was last covered in a report dated ’07 April 2025’.
ILA’s Technical Analysis:
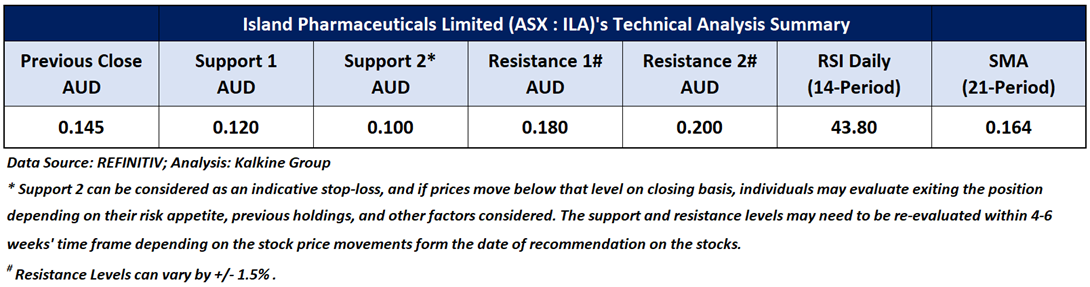
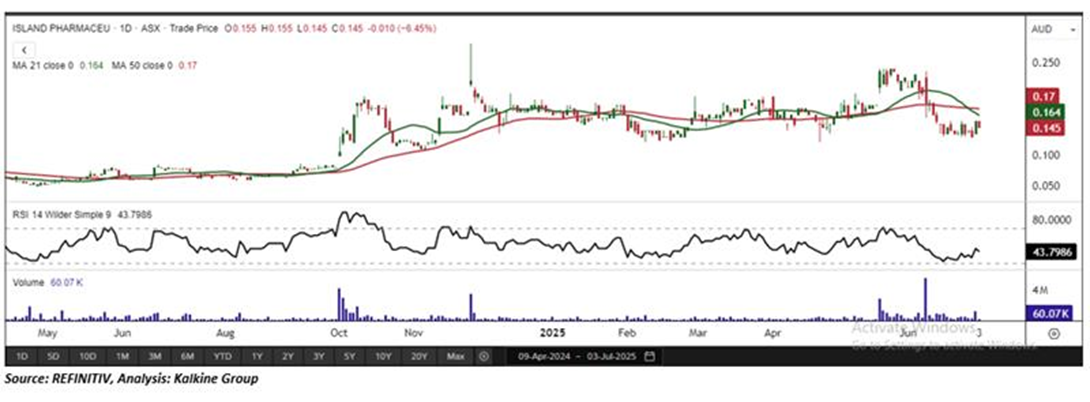
On the daily chart, ILA's stock price is forming a trading range characterized by lower highs and higher lows, suggesting that the current sideways period in the stock might remain in place in the near term. Additionally, the RSI (14-period) is trading near its midpoint, adding more evidence to the previous observation. Prices are trading between its previous peak and trough, which may potentially function as resistance and support levels for the stocks, respectively. Critical support for the stock is positioned at AUD 0.120, while significant resistance is placed at AUD 0.180.
Daily Technical Chart – ILA
Individuals can evaluate the stock based on the support and resistance levels provided in the report in case of keen interest, taking into consideration the risk-reward scenario.
Considering the stock’s current price levels forming higher peaks and higher troughs, and momentum oscillator analysis, a “Watch” recommendation is given on the stock. The stock was analysed as per the closing price of AUD 0.145 per share as on 03 July 2025, down by 0.45%.
RPG’s Technical Analysis:
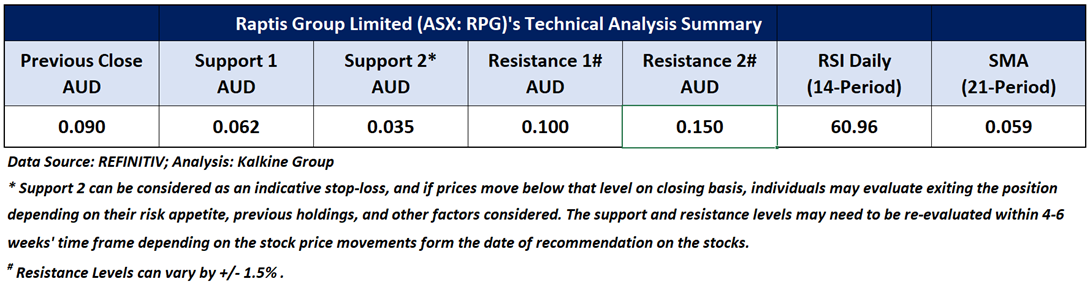
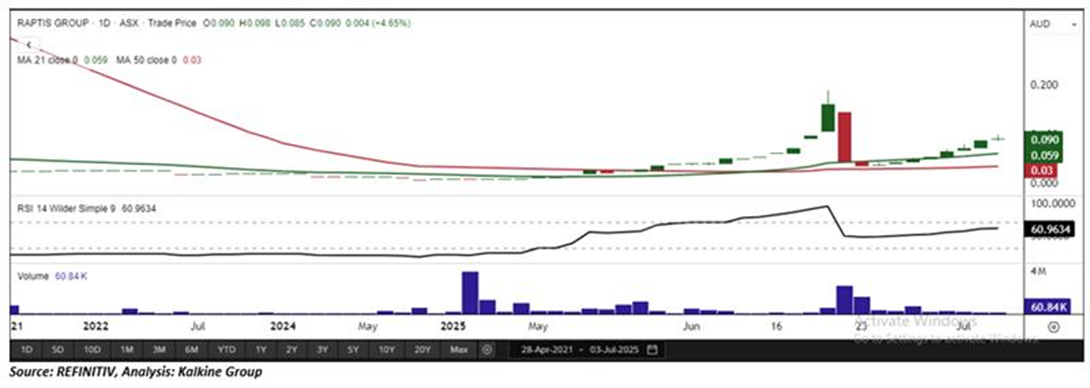
On the daily chart, RPG's stock price is trading between its previous peak and trough, indicating a neutral trend. Additionally, the RSI (14-period) is trading near its midpoint, adding more evidence to the previous observation. Prices are trading between its previous peak and trough, which may potentially function as resistance and support levels for the stocks, respectively. Critical support for the stock is positioned at AUD 0.062, while significant resistance is placed at AUD 0.100.
Daily Technical Chart – RPG
Individuals can evaluate the stock based on the support and resistance levels provided in the report in case of keen interest, taking into consideration the risk-reward scenario.
Considering the stock’s current price levels forming higher peaks and higher troughs, and momentum oscillator analysis, a “Watch” recommendation is given on the stock. The stock was analysed as per the closing price of AUD 0.090 per share as on 03 July 2025, up by 4.65%.
Note 1: Past performance is neither an Indicator nor a guarantee of future performance.
Note 2: Investment decision should be made depending on an individual’s appetite for upside potential, risks, and any previous holdings. This recommendation is purely based on technical analysis, and fundamental analysis has not been considered in this report.
Note 3: Related Risks: This report may be looked at from high-risk perspective and recommendations are provided are for a short duration. Recommendations provided in this report are solely based on technical parameters, and the fundamental performance of the stocks has not been considered in the decision-making process. Other factors which could impact the stock prices include market risks, regulatory risks, interest rates risks, currency risks, social and political instability risks etc.
The reference date for all price data, currency, technical indicators, support, and resistance levels is July 03, 2025. The reference data in this report has been partly sourced from REFINITIV.
Technical Indicators Defined:
Support: A level at which the stock prices tend to find support if they are falling, and a downtrend may take a pause backed by demand or buying interest. Support 1 refers to the nearby support level for the stock and if the price breaches the level, then Support 2 may act as the crucial support level for the stock.
Resistance: A level at which the stock prices tend to find resistance when they are rising, and an uptrend may take a pause due to profit booking or selling interest. Resistance 1 refers to the nearby resistance level for the stock and if the price surpasses the level, then Resistance 2 may act as the crucial resistance level for the stock.
Stop-loss: It is a level to protect further losses in case of unfavourable movement in the stock prices.
The Green colour line reflects the 21-period moving average. SMA helps to identify existing price trends. If the prices are trading above the 21-period, prices are currently in a bullish trend (Vice – Versa).
The Blue colour line reflects the 50-period moving average. SMA helps to identify existing price trends. If the prices are trading above the 50-period, prices are currently in a bullish trend (Vice – Versa).
The Orange/ Yellow colour line represents the Trendline.
The Purple colour line in the chart’s lower segment reflects the Relative Strength Index (14-Period), which indicates price momentum and signals momentum in trend. A reading of 70 or above suggests overbought status, while a reading of 30 or below suggests an oversold status.

 Please wait processing your request...