This report is an updated version of the report published on 08 October 2025, at 11:57 AM AEDT
NOVONIX Limited (ASX: NVX)
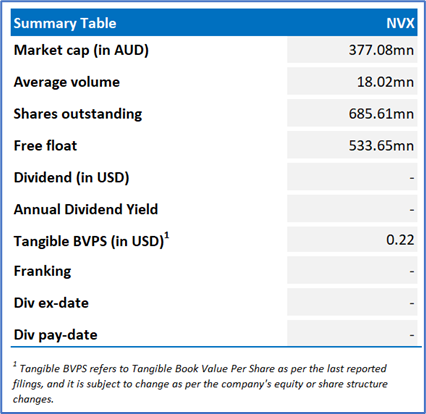
NVX is a battery materials and technology corporation. The company offers advanced materials, equipment, and services to support the global lithium-ion battery industry.
Recommendation Rationale – SELL at AUD 0.650
- Financial Highlights: Cash and cash equivalents decreased to USD 24.82mn as on 30 June 2025 vs USD 42.56mn as on 31 December 2024. Receipts from customers (inclusive of consumption tax) down to USD 2.85mn in 1HFY25 vs USD 3.61mn in 1HFY24.
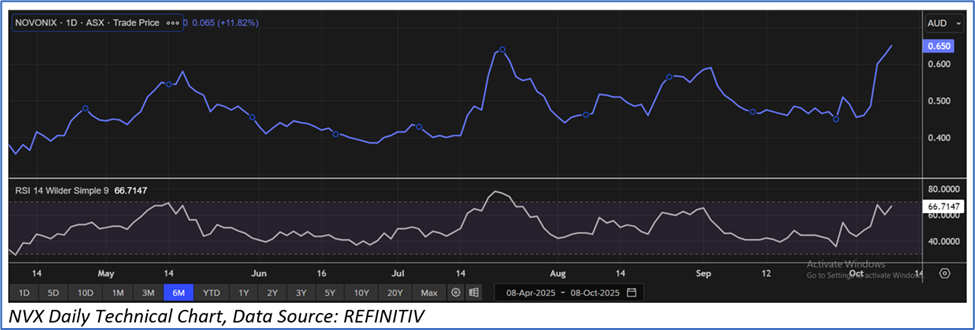
- Trading Near the Resistance: NVX stock is nearing the R2 level recommended on 22 August 2025 and could face resistance at its current price.
- Overvalued Multiples: On a forward 12-month basis – key trading multiples (EV/Sales, Price/ Book Value) are higher than Median of the Industrial Sector.
- Market Risk: NOVONIX faces competition from established synthetic and natural graphite producers (particularly in China) who have lower cost bases. This could pressure margins unless NOVONIX achieves scale, efficiency and favourable supply chain sourcing.
Daily Price Chart
Valuation Methodology: EV/Sales Multiple Approach (FY December'26E) (Illustrative)
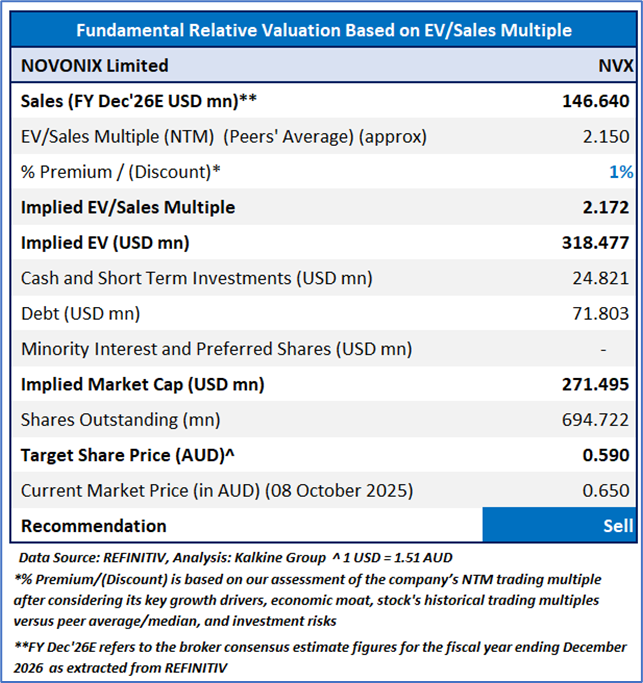
Stock might trade at a slight premium to its peers considering the YoY growth in revenue in 1HFY25, major plant construction progress, strengthened north American supply chain, strategic land acquisition for expansion, etc. For conducting the valuation, the following peers included: EROAD Ltd (ASX: ERD), Structural Monitoring Systems PLC (ASX: SMN), Aucyber Ltd (ASX: CYB), and other have been considered.
Considering that the stock is trading close to its R2 level, macroeconomic uncertainty, share price movement, current trading level, and risks associated, the share price can face consolidation at the current levels. Hence, a ‘Sell’ recommendation is given on the stock at the current market price of AUD 0.650, at 11:04 AM AEDT, as of 8 October 2025.
Markets are trading in a highly volatile zone currently due to certain macro-economic issues and geopolitical issues prevailing geopolitical tensions. Therefore, it is prudent to follow a cautious approach while investing.
Note 1: Past performance is neither an indicator nor a guarantee of future performance.
Note 2: The reference date for all price data, currency, technical indicators, support, and resistance levels is 08 October 2025. The reference data in this report has been partly sourced from REFINITIV.
Note 3: Investment decisions should be made depending on an individual's appetite for upside potential, risks, holding duration, and any previous holdings. An 'Exit' from the stock can be considered if the Target Price mentioned as per the Valuation and or the technical levels provided have been achieved and is subject to the factors discussed above.
Note 4: Kalkine reports are prepared based on the stock prices captured either from REFINITIV or Trading View. Typically, REFINITIV or Trading View may reflect stock prices with a delay which could be a lag of 25-30 minutes. There can be no assurance that future results or events will be consistent with the information provided in the report. The information is subject to change without any prior notice.
Technical Indicators Defined: -
Support: A level at which the stock prices tend to find support if they are falling, and downtrend may take a pause backed by demand or buying interest.
Resistance: A level at which the stock prices tend to find resistance when they are rising, and uptrend may take a pause due to profit booking or selling interest.
Stop-loss: In general, it is a level to protect further losses in case of any unfavourable movement in the stock prices.

 Please wait processing your request...