This report is an updated version of the report published on 28 May 2025 at 11:34 AM AEST.
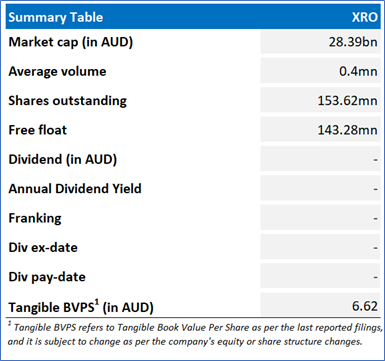
Xero Limited (ASX: XRO)
Xero Limited (ASX: XRO) is an international platform designed for small businesses, boasting 4.2 million subscribers. Its intelligent tools assist small businesses and their advisors in managing essential accounting functions such as tax and bank reconciliation, as well as other critical tasks such as payroll and payments.
Recommendation Rationale – SELL at AUD 186.48
- Trading Around Resistance: XRO’s share price surpassed its R1 level recommended on 9 May 2025. Therefore, XRO can face correction at the current levels.
- Technical Standpoint: The momentum oscillator, 14-day RSI (~72.44) indicates that share price is trading in the overbought zone; therefore, retracement can be expected at the current levels.
- No Dividend Paid: During FY25, XRO did not distribute dividends, despite seeing an increase in gross profit and EBITDA. If future financial performance is weaker than expected or fails to meet expectations, it could result in a decrease in the company's stock price.
- Rising Costs: The company noted increased operating expenses in FY25 (up 20% YoY) attributed to higher product design & development, general & administration, among others. In FY26, XRO expects total operating expenses to represent roughly 71.5% of revenue, with increased spending on product design and development compared to FY25. These factors are expected to exert downward pressure on its margins in the future.
- Emerging Risks: XRO’s business model depends on subscription revenue from its customers. Any drop in subscriber growth or high churn rates could harm its financial performance and sustainability. Technological advancements could make the company’s current offerings outdated or less competitive. Disruptions such as server outages could also harm service delivery and weaken customer trust.
XRO Daily Chart
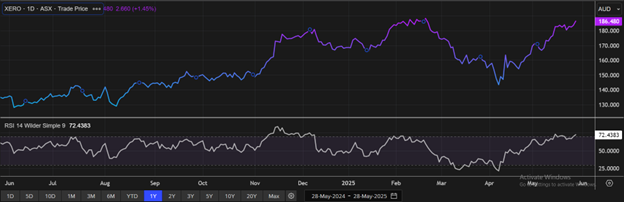
XRO Daily Technical Chart, Data Source: REFINITIV
Valuation Methodology: P/E Approach (FY March'26E) (Illustrative)
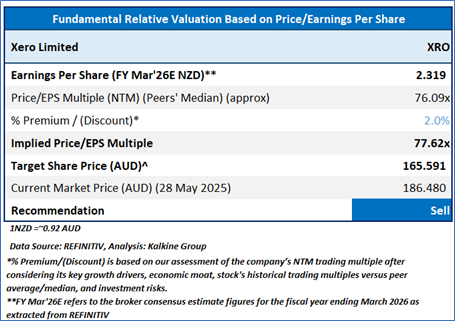
Stock might trade at a slight premium to its peers, considering 21% YoY ARPU growth and 48% YoY rise in free cash flow in FY25, balanced model focused on simultaneously growing revenue and profits, disciplined cost control and increasing operating leverage, and other factors. Peers include WiseTech Global Ltd (ASX: WTC), TechnologyOne Ltd (ASX: TNE), Bravura Solutions Ltd (ASX: BVS), and others
Considering that the stock has surpassed its R1 level, rally in share price movement, current trading level, and risks associated, the share price can face consolidation at the current levels. Hence, a ‘Sell’ recommendation is given on the stock at the current price of AUD 186.48 (as of 28 May 2025, at 10:58 AM AEST).
Markets are trading in a highly volatile zone currently due to certain macro-economic issues and geopolitical issues prevailing geopolitical tensions. Therefore, it is prudent to follow a cautious approach while investing.
Note 1: Past performance is neither an indicator nor a guarantee of future performance.
Note 2: The reference date for all price data, currency, technical indicators, support, and resistance levels is 28 May 2025. The reference data in this report has been partly sourced from REFINITIV.
Note 3: Investment decisions should be made depending on an individual's appetite for upside potential, risks, holding duration, and any previous holdings. An 'Exit' from the stock can be considered if the Target Price mentioned as per the Valuation and or the technical levels provided has been achieved and is subject to the factors discussed above.
Note 4: Kalkine reports are prepared based on the stock prices captured either from REFINITIV or Trading View. Typically, REFINITIV or Trading View may reflect stock prices with a delay which could be a lag of 25-30 minutes. There can be no assurance that future results or events will be consistent with the information provided in the report. The information is subject to change without any prior notice.
Technical Indicators Defined: -
Support: A level at which the stock prices tend to find support if they are falling, and downtrend may take a pause backed by demand or buying interest.
Resistance: A level at which the stock prices tend to find resistance when they are rising, and uptrend may take a pause due to profit booking or selling interest.
Stop-loss: In general, it is a level to protect further losses in case of any unfavourable movement in the stock prices.

 Please wait processing your request...