This report is an updated version of the report published on 23 July 2025 at 11:52 AM AEST.
WiseTech Global Limited (ASX: WTC)
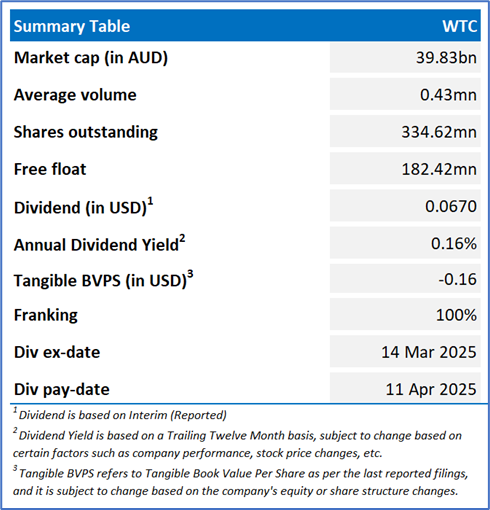
WTC caters to the global logistics execution industry with software solutions. Its client list includes more than 17,000 of the world’s logistics companies across 183 countries. Its flagship technology is CargoWise for logistics service providers.
Recommendation Rationale – SELL at AUD 119.38
- Financial Highlights: In 1HFY25, Recurring One-Time License (OTL) and support services segment revenue saw a 6% YoY decline to USD 9.0mn, down from USD 9.6mn in 1HFY24. Concurrently, the cost of revenues rose 2% YoY to USD 57.1mn in 1HFY25 vs USD 55.8mn in 1HFY24. Total operating expenses increased by 11% YoY to USD 174.3mn in 1HFY25 from USD 156.7mn in 1HFY24, primarily due to higher spending on product design and development, and general and administration.
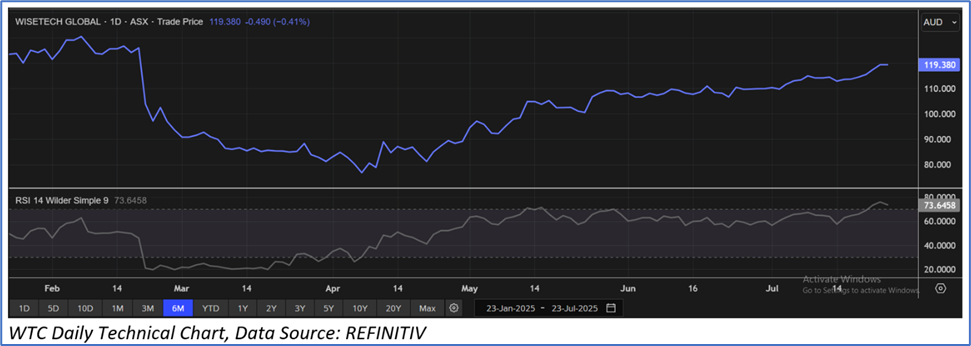
- Trading Near the Resistance: WTC stock has surpassed its R2 level recommended on 3 April 2025. Therefore, share price can face resistance at the current levels.
- Overvalued Multiples: On a trailing 12-month basis – key trading multiples (EV/Sales, EV/EBITDA, Price/Earnings, Price/Book, Price/Cash Flow) are higher than industry median of the Technology Sector.
- Market Risk: As a provider of software for business-critical systems, WTC’s performance is influenced by the state of the global economy and fluctuations in enterprise IT spending. Additionally, due to its management of sensitive data, WTC is exposed to cybersecurity risks, where potential breaches could result in financial losses, regulatory sanctions, and damage to its reputation.
WTC’ Daily Price Chart
Valuation Methodology: Price/Earnings Multiple Approach (FY June'26E) (Illustrative)
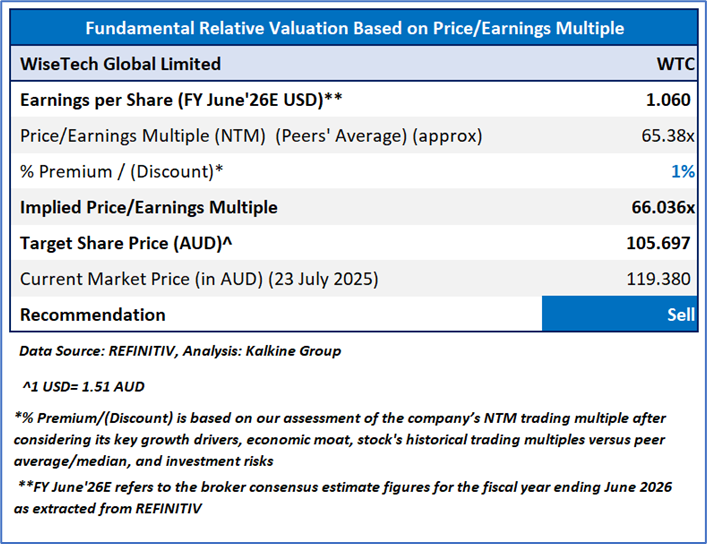
Stock might trade at a slight premium to its peers considering the YoY revenue increase in 1HFY25, YoY growth in net income after tax in 1HFY25, and projected revenue and EBITDA for FY25. For conducting the valuation, the following peers have been included: TechnologyOne Ltd (ASX: TNE), Nuix Ltd (ASX: NXL), Bravura Solutions Ltd (ASX: BVS), and other have been considered.
Considering that the stock has surpassed its R2 level, macroeconomic uncertainty, share price movement, current trading level, and risks associated, the share price can face consolidation at the current levels. Hence, a ‘Sell’ recommendation is given on the stock at the current market price of AUD 119.38, at 10:35 AM AEST, as of 23 July 2025.
Markets are trading in a highly volatile zone currently due to certain macro-economic issues and geopolitical issues prevailing geopolitical tensions. Therefore, it is prudent to follow a cautious approach while investing.
Note 1: Past performance is neither an indicator nor a guarantee of future performance.
Note 2: The reference date for all price data, currency, technical indicators, support, and resistance levels is 23 July 2025. The reference data in this report has been partly sourced from REFINITIV.
Note 3: Investment decisions should be made depending on an individual's appetite for upside potential, risks, holding duration, and any previous holdings. An 'Exit' from the stock can be considered if the Target Price mentioned as per the Valuation and or the technical levels provided has been achieved and is subject to the factors discussed above.
Note 4: Kalkine reports are prepared based on the stock prices captured either from REFINITIV or Trading View. Typically, REFINITIV or Trading View may reflect stock prices with a delay which could be a lag of 25-30 minutes. There can be no assurance that future results or events will be consistent with the information provided in the report. The information is subject to change without any prior notice.
Note 5: Dividend Yield may vary as per the stock price movement.
Technical Indicators Defined: -
Support: A level at which the stock prices tend to find support if they are falling, and downtrend may take a pause backed by demand or buying interest.
Resistance: A level at which the stock prices tend to find resistance when they are rising, and uptrend may take a pause due to profit booking or selling interest.
Stop-loss: In general, it is a level to protect further losses in case of any unfavourable movement in the stock prices.

 Please wait processing your request...