This report is an updated version of the report published on 30 April 2025 at 12:20 PM AEST
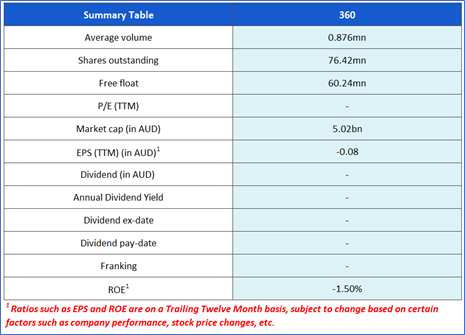
Life360 Inc. (ASX: 360)
Life360 Inc. (ASX: 360) provides location-based sharing tracking and messaging solution. It provides its circle members safety-related solutions, including crash detection, crime reports, and roadside assistance.
Recommendation Rationale – SELL at AUD 22.220
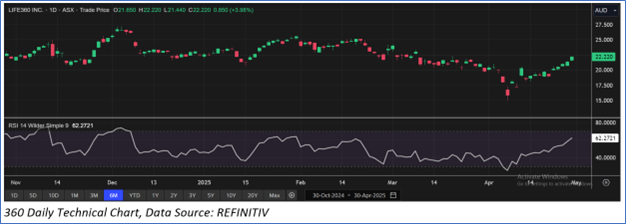
- Trading Around Resistance: 360’s share price surpassed its R1 level recommended on 16 April 2025.
- Overvalued Multiples: On a forward 12-month basis - key valuation multiples (EV/Sales, P/CF, P/B, EV/EBITDA and Price/Earnings) are higher than the median of the technology sector.
- Decline in Hardware Revenue – FY24 saw a 1% YoY decline in hardware revenue, primarily driven by delay in new product launches, which led to lower sales volume.
- Emerging Risks: The company is exposed to supply chain disruptions, privacy concerns over location data sales, regulatory scrutiny regarding tracking devices, increased competition, among others.
360 Daily Chart
Valuation Methodology: P/CF Approach (FY Dec'25E) (Illustrative)
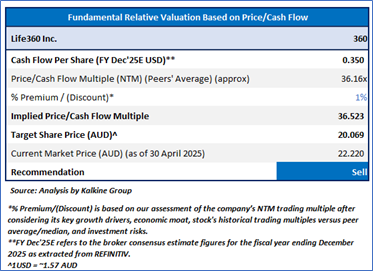
Considering the subscription revenue momentum, increases in data and partnership revenue, Triple Tier membership launches in the UK and ANZ, etc., the company might trade at a slight premium to its peers. For valuation, few peers like TechnologyOne Ltd (ASX: TNE), WiseTech Global Ltd (ASX: WTC), Xero Ltd (ASX: XRO), and others have been considered.
Considering that the stock has surpassed it R1 level, macroeconomic uncertainty, rally in share price movement, current trading level, and risks associated, the share price can face consolidation at the current levels. Hence, a ‘Sell’ recommendation is given on the stock at the current price of AUD 22.220 (as of 30 April 2025, at 11:16 AM AEST).
Note: This report may be updated with details around fundamental and technical analysis, price/ chart in due course, as appropriate.
Note 1: Past performance is neither an indicator nor a guarantee of future performance.
Note 2: The reference date for all price data, currency, technical indicators, support, and resistance levels is 30 April 2025. The reference data in this report has been partly sourced from REFINITIV.
Note 3: Investment decisions should be made depending on an individual's appetite for upside potential, risks, holding duration, and any previous holdings. An 'Exit' from the stock can be considered if the Target Price mentioned as per the Valuation and or the technical levels provided has been achieved and is subject to the factors discussed above.
Note 4: Kalkine reports are prepared based on the stock prices captured either from REFINITIV or Trading View. Typically, REFINITIV or Trading View may reflect stock prices with a delay which could be a lag of 25-30 minutes. There can be no assurance that future results or events will be consistent with the information provided in the report. The information is subject to change without any prior notice.
Technical Indicators Defined: -
Support: A level at which the stock prices tend to find support if they are falling, and a downtrend may take a pause backed by demand or buying interest. Support 1 refers to the nearby support level for the stock and if the price breaches the level, then Support 2 may act as the crucial support level for the stock.
Resistance: A level at which the stock prices tend to find resistance when they are rising, and an uptrend may take a pause due to profit booking or selling interest. Resistance 1 refers to the nearby resistance level for the stock and if the price surpasses the level, then Resistance 2 may act as the crucial resistance level for the stock.
Stop-loss: It is a level to protect further losses in case of unfavourable movement in the stock prices.

 Please wait processing your request...