This report is an updated version of the report published on 14 July 2025 at 3:55 PM AEST.
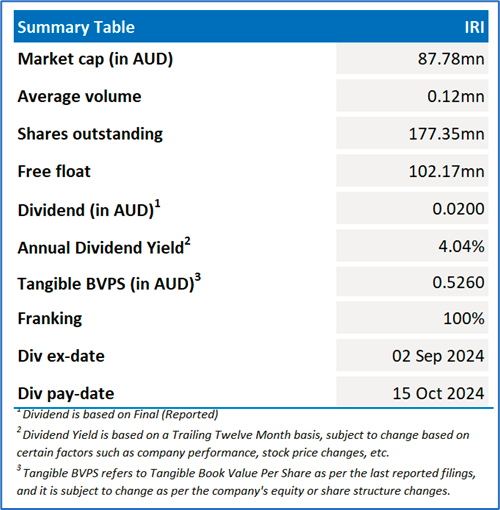
Integrated Research Limited (ASX: IRI)
IRI is a global provider of user experience and performance management solutions for payment transactions and collaborative systems. The company leverages its real-time, scalable hybrid cloud platform and deep domain expertise to optimise mission-critical systems and enhance user experience. Serving some of the world’s largest organisations, IRI simplifies complexity and provides critical visibility across systems that enable seamless transactions and collaboration worldwide.
Recommendation Rationale – SELL at AUD 0.485
- Decline in Top and Bottom Line: Total revenue declined by 29% YoY to AUD 28.84mn in 1HFY25 vs AUD 40.84mn in 1HFY24, due to the lower license fees, maintenance fees, subscription fees, and professional services. Net profit after income tax decreased by 59% YoY to AUD 4.57mn in 1HFY25 vs AUD 11.18mn in 1HFY24.
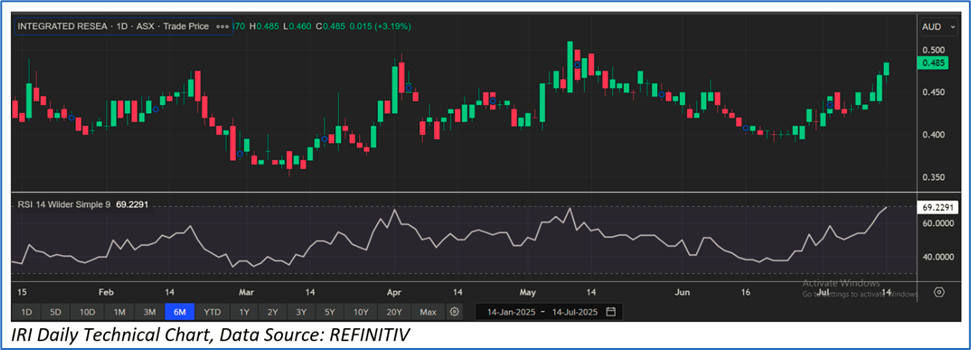
- Trading Near the Resistance: IRI stock has surpassed its R2 level recommended on 20 June 2025. Therefore, share price can face resistance at the current levels.
- Overvalued Multiples: On a trailing 12-month basis – key trading multiples (EV/EBITDA, Price/Earnings, Price/Cash Flow) are higher than median of the Technology Sector.
- Market Risk: As a software provider to business-critical systems, IRI's performance can be affected by the health of the global economy and enterprise IT spending cycles.
IRI’s Daily Price Chart
Valuation Methodology: Price/Cash Flow Multiple Approach (FY June'26E) (Illustrative)
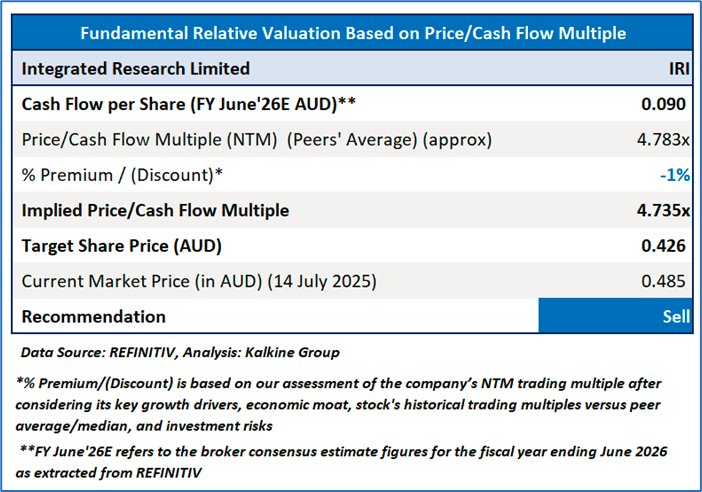
Stock might trade at a slight discount to its peers considering the YoY revenue decrease in 1HFY25, lower net income after tax in 1HFY25, softer renewals book in 1HFY25, etc. For conducting the valuation, the following peers have been included: Readytech Holdings Ltd (ASX: RDY), Etherstack PLC (ASX: ESK), DUG Technology Ltd (ASX: DUG), and other have been considered.
Considering that the stock has crossed its R2 level, macroeconomic uncertainty, share price movement, current trading level, and risks associated, the share price can face consolidation at the current levels. Hence, a ‘Sell’ recommendation is given on the stock at the current price of AUD 0.485 (as of 14 July 2025, at 3:44 PM AEST).
Markets are trading in a highly volatile zone currently due to certain macro-economic issues and geopolitical issues prevailing geopolitical tensions. Therefore, it is prudent to follow a cautious approach while investing.
Note 1: Past performance is neither an indicator nor a guarantee of future performance.
Note 2: The reference date for all price data, currency, technical indicators, support, and resistance levels is 14 July 2025. The reference data in this report has been partly sourced from REFINITIV.
Note 3: Investment decisions should be made depending on an individual's appetite for upside potential, risks, holding duration, and any previous holdings. An 'Exit' from the stock can be considered if the Target Price mentioned as per the Valuation and or the technical levels provided has been achieved and is subject to the factors discussed above.
Note 4: Kalkine reports are prepared based on the stock prices captured either from REFINITIV or Trading View. Typically, REFINITIV or Trading View may reflect stock prices with a delay which could be a lag of 25-30 minutes. There can be no assurance that future results or events will be consistent with the information provided in the report. The information is subject to change without any prior notice.
Note 5: Dividend Yield may vary as per the stock price movement.
Technical Indicators Defined: -
Support: A level at which the stock prices tend to find support if they are falling, and downtrend may take a pause backed by demand or buying interest.
Resistance: A level at which the stock prices tend to find resistance when they are rising, and uptrend may take a pause due to profit booking or selling interest.
Stop-loss: In general, it is a level to protect further losses in case of any unfavourable movement in the stock prices.

 Please wait processing your request...