This report is an updated version of the report published on 6 August 2025 at 12:21 PM AEST.
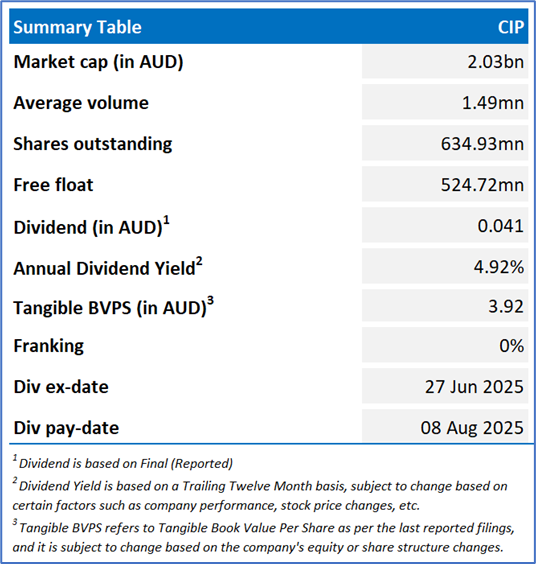
Centuria Industrial REIT (ASX: CIP)
CIP is an Australia-based real estate investment trust (REIT) that has been listed on the ASX since December 2012. The company focuses on building a portfolio of industrial assets located in urban infill areas throughout Australia, supported by a diverse tenant base.
Recommendation Rationale – SELL at AUD 3.355
- Weaker Financial Position: Cash and cash equivalents decreased to AUD 15.04mn as on 30 June 2025 vs AUD 16.54mn as on 30 June 2024, due to higher borrowing costs and distributions paid during the period. The company’s non-current borrowings increased to AUD 1,059.20mn as on 30 June 2025 vs AUD 1,045.53mn as on 30 June 2024.
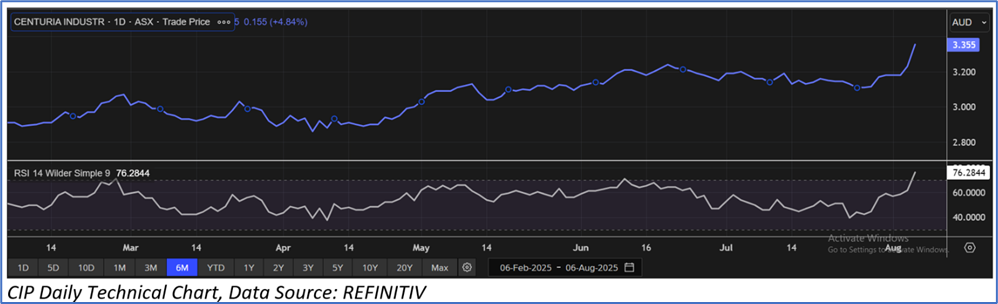
- Technical Resistance Risk Building: With the (14-day) RSI nearing 76.28 and price action approaching the R2 level recommended on 28 January 2025, the stock may enter overbought territory. Momentum may face resistance given the prevailing fundamental and technical risks.
- Overvalued Multiples: On a forward 12-month basis – key trading multiples (EV/Sales, EV/EBITDA, Price/Cash Flow, Price/Earnings) are higher than median of the real estate sector.
- Market Risk: With a high percentage of assets located in Australia’s core east coast cities, CIP faces the risk that adverse regional economic or real estate conditions (such as over-supply, falling demand, or market downturns) could disproportionately impact its portfolio performance.
CIP’s Daily Price Chart
Valuation Methodology: Price/Earnings Multiple Approach (FY June'26E) (Illustrative)
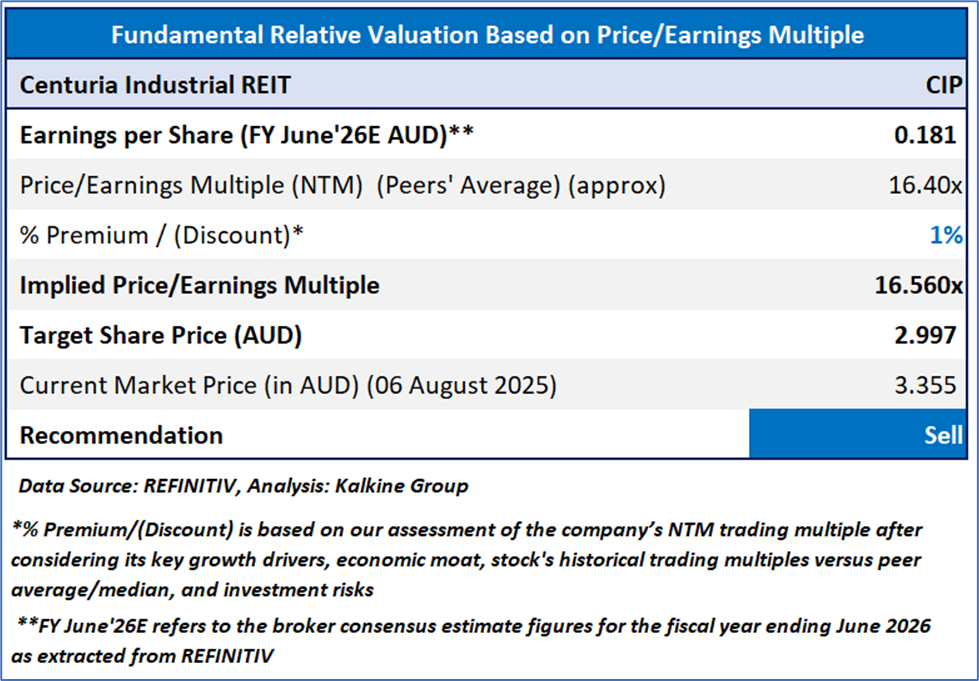
Stock might trade at a slight premium to its peers considering the YoY growth in funds from operations (FFO) in FY25, YoY increase in net operating income (NOI) in FY25 and expected increase in FFO per unit of up to 6% in FY26. For conducting the valuation, peers considered include GPT Group (ASX: GPT), Stockland Corporation Ltd (ASX: SGP), Dexus Industria REIT (ASX: DXI), among others.
Considering that the stock has surpassed its R1 level, macroeconomic uncertainty, share price movement, current trading level, and risks associated, the share price can face consolidation at the current levels. Hence, a ‘Sell’ recommendation is given on the stock at the current market price of AUD 3.355, at 11:55 AM AEST, as of 6 August 2025.
Markets are trading in a highly volatile zone currently due to certain macro-economic issues and geopolitical issues prevailing geopolitical tensions. Therefore, it is prudent to follow a cautious approach while investing.
Note 1: Past performance is neither an indicator nor a guarantee of future performance.
Note 2: The reference date for all price data, currency, technical indicators, support, and resistance levels is 6 August 2025. The reference data in this report has been partly sourced from REFINITIV.
Note 3: Investment decisions should be made depending on an individual's appetite for upside potential, risks, holding duration, and any previous holdings. An 'Exit' from the stock can be considered if the Target Price mentioned as per the Valuation and or the technical levels provided has been achieved and is subject to the factors discussed above.
Note 4: Kalkine reports are prepared based on the stock prices captured either from REFINITIV or Trading View. Typically, REFINITIV or Trading View may reflect stock prices with a delay which could be a lag of 25-30 minutes. There can be no assurance that future results or events will be consistent with the information provided in the report. The information is subject to change without any prior notice.
Note 5: Dividend Yield may vary as per the stock price movement.
Technical Indicators Defined: -
Support: A level at which the stock prices tend to find support if they are falling, and downtrend may take a pause backed by demand or buying interest.
Resistance: A level at which the stock prices tend to find resistance when they are rising, and uptrend may take a pause due to profit booking or selling interest.
Stop-loss: In general, it is a level to protect further losses in case of any unfavourable movement in the stock prices.

 Please wait processing your request...