This report is an updated version of the report published on 4 June 2025 at 4:58 PM AEST.
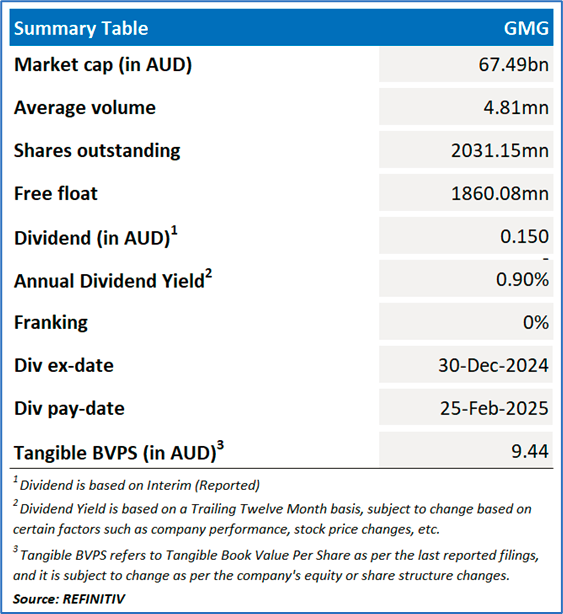
Goodman Group Ltd (ASX: GMG)
GMG is an ASX listed integrated property group with operations throughout Australia, New Zealand, Asia, Europe, the United Kingdom, and the Americas.
Recommendation Rationale – SELL at AUD 33.23
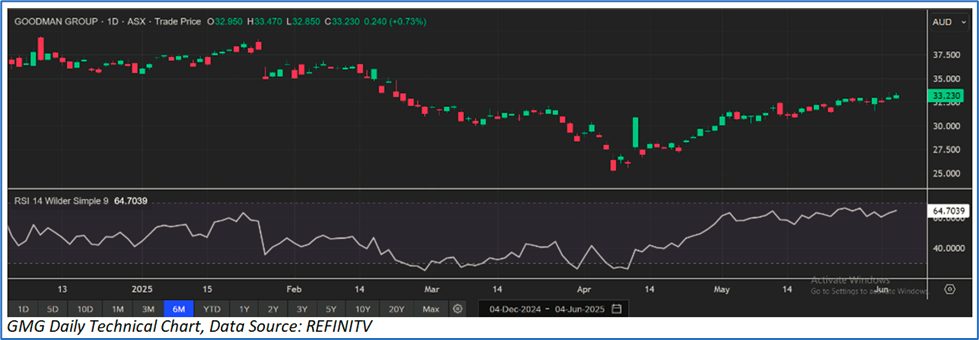
- Trading Around Resistance: The stock has surpassed its first resistance (R1) of AUD 29.326 and is approaching R2 of AUD 31.460. However, its 14-day RSI is showing a reading of ~64.70; hence, the stock may face some consolidation before scaling further upside.
- Property Development Earnings Declined in H1FY25: In H1FY25, GMG's Development earnings declined by 13% year-on-year to AUD 700.7mn. Further, the company expects development earnings in H1FY25 to be similar to H1FY25. However, for the full FY25, development earnings are expected to rise slightly over FY24.
- Overvalued Multiples: On a forward 12-month basis - key valuation multiples (EV/EBITDA, EV/Sales, P/E and Price/Book Value and Price/Cash Flow) are higher than median of the Residential & Commercial REIT industry.
- Valuation & Asset Repricing Risk: Property valuations could fall due to macroeconomic pressures, interest rate increase, or reduced investor demand. Any negative revaluation due to the above-mentioned factors could affect reported earnings and net tangible asset (NTA) value.
GMG Daily Chart
Valuation Methodology: Price/Book Value Multiple Approach (FY June'26E) (Illustrative)
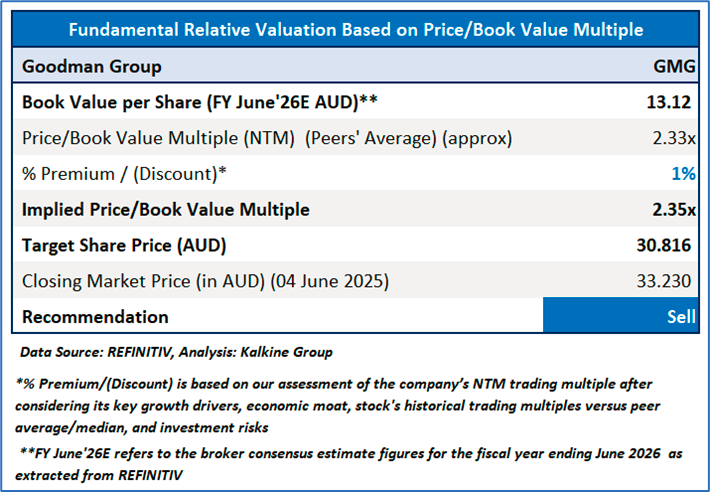
Considering the revenue growth in 1HFY25, increased operating earnings per security (OEPS) in 1HFY25, expansion in data centres, and high portfolio occupancy, the stock might trade at a slight premium to its peers. For valuation, a few peers like, Charter Hall Group (ASX: CHC), Stockland Corporation Ltd (ASX: SGP) and Ingenia Communities Group (ASX: INA) have been considered.
Given its current trading levels, recent rally in the share price, and risks associated, it is prudent to sell the stock at the current levels. Hence, a ‘Sell’ recommendation is given on the stock at the closing market price of AUD 33.230, up ~0.73%, as of 4 June 2025.
Markets are trading in a highly volatile zone currently due to certain macro-economic issues and geopolitical issues prevailing geopolitical tensions. Therefore, it is prudent to follow a cautious approach while investing.
Note 1: Past performance is neither an indicator nor a guarantee of future performance.
Note 2: The reference date for all price data, currency, technical indicators, support, and resistance levels is 4 June 2025. The reference data in this report has been partly sourced from REFINITIV.
Note 3: Investment decisions should be made depending on an individual's appetite for upside potential, risks, holding duration, and any previous holdings. An 'Exit' from the stock can be considered if the Target Price mentioned as per the Valuation and or the technical levels provided has been achieved and is subject to the factors discussed above.
Note 4: Kalkine reports are prepared based on the stock prices captured either from REFINITIV or Trading View. Typically, REFINITIV or Trading View may reflect stock prices with a delay which could be a lag of 25-30 minutes. There can be no assurance that future results or events will be consistent with the information provided in the report. The information is subject to change without any prior notice.
Note 5: Dividend Yield may vary as per the stock price movement.
Technical Indicators Defined: -
Support: A level at which the stock prices tend to find support if they are falling, and a downtrend may take a pause backed by demand or buying interest. Support 1 refers to the nearby support level for the stock and if the price breaches the level, then Support 2 may act as the crucial support level for the stock.
Resistance: A level at which the stock prices tend to find resistance when they are rising, and an uptrend may take a pause due to profit booking or selling interest. Resistance 1 refers to the nearby resistance level for the stock and if the price surpasses the level, then Resistance 2 may act as the crucial resistance level for the stock.
Stop-loss: It is a level to protect further losses in case of unfavourable movement in the stock prices.

 Please wait processing your request...