This report is an updated version of the report published on 5 May 2025 at 1:04 PM AEST.
Rural Funds Group (ASX: RFF)
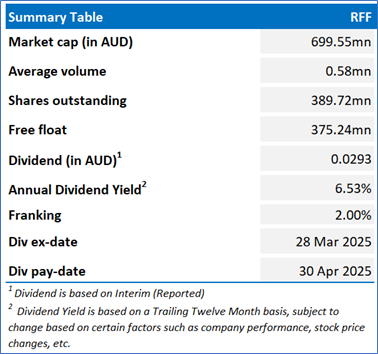
Rural Funds Group (ASX: RFF) is an agricultural Real Estate Investment Trust (REIT) with a diversified portfolio of Australian agricultural assets. RFF obtains its revenue from leasing almond orchards, cropping properties, macadamia orchards, agricultural plants and equipment, vineyards, cattle properties, and water rights. The company includes the stapled units in two Trusts, namely, Rural Funds Trust (RFT) and RF Active (RFA).
Recommendation Rationale – SELL at AUD 1.815
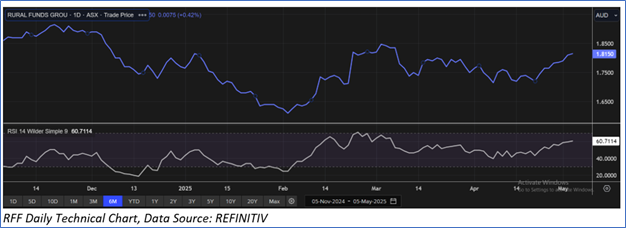
- Trading Around Resistance: RFF’s share price surpassed its R1 level recommended on 28 January 2025.
- Decline in NAV: Adjusted net asset value (NAV) declined by 1.2% year-on-year in the first half of FY25 to AUD 3.10 per unit, mainly driven by revaluations of interest rate swaps.
- Overvalued Multiples: On a forward 12-month basis - key valuation multiples (EV/Sales, and EV/EBITDA) are higher than median of the Real Estate Sector.
- Emerging Risks: Fluctuations in capital and debt markets may impact the Group’s ability to obtain financing. Severe weather events also pose a threat, potentially damaging assets and disrupting operations. RFF acknowledges the risks associated with climate change and proactively manages these challenges through its climate diversification strategy.
RFF Daily Chart
Valuation Methodology: P/E Approach (FY June'26E) (Illustrative)
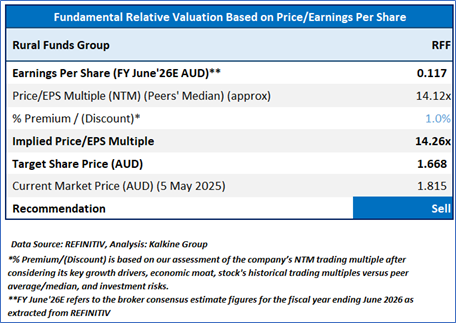
Stock might trade at a slight premium to its peers, considering the successfully refinanced syndicated debt facility, increased rental income from macadamia developments, etc. Peers include HMC Capital Ltd (ASX: HMC), GPT Group (ASX: GPT), Charter Hall Group (ASX: CHC), and others.
Considering that the stock has surpassed its R1 level, macroeconomic uncertainty, current trading level, and risks associated, the share price can face consolidation at the current levels. Hence, a ‘Sell’ recommendation is given on the stock at the current market price of AUD 1.815, at 11:55 AM, AEST, as of 5 May 2025.
Note: This report may be updated with details around fundamental and technical analysis, price/ chart in due course, as appropriate.
Note 1: Past performance is neither an indicator nor a guarantee of future performance.
Note 2: The reference date for all price data, currency, technical indicators, support, and resistance levels is 5 May 2025. The reference data in this report has been partly sourced from REFINITIV.
Note 3: Investment decisions should be made depending on an individual's appetite for upside potential, risks, holding duration, and any previous holdings. An 'Exit' from the stock can be considered if the Target Price mentioned as per the Valuation and or the technical levels provided has been achieved and is subject to the factors discussed above.
Note 4: Kalkine reports are prepared based on the stock prices captured either from REFINITIV or Trading View. Typically, REFINITIV or Trading View may reflect stock prices with a delay which could be a lag of 25-30 minutes. There can be no assurance that future results or events will be consistent with the information provided in the report. The information is subject to change without any prior notice.
Note 5: Dividend Yield may vary as per the stock price movement.
Technical Indicators Defined: -
Support: A level at which the stock prices tend to find support if they are falling, and a downtrend may take a pause backed by demand or buying interest. Support 1 refers to the nearby support level for the stock and if the price breaches the level, then Support 2 may act as the crucial support level for the stock.
Resistance: A level at which the stock prices tend to find resistance when they are rising, and an uptrend may take a pause due to profit booking or selling interest. Resistance 1 refers to the nearby resistance level for the stock and if the price surpasses the level, then Resistance 2 may act as the crucial resistance level for the stock.
Stop-loss: It is a level to protect further losses in case of unfavourable movement in the stock prices.

 Please wait processing your request...