This report is an updated version of the report published on 19 June 2025 at 11:17 AM AEST.
PEXA Group Limited (ASX: PXA)
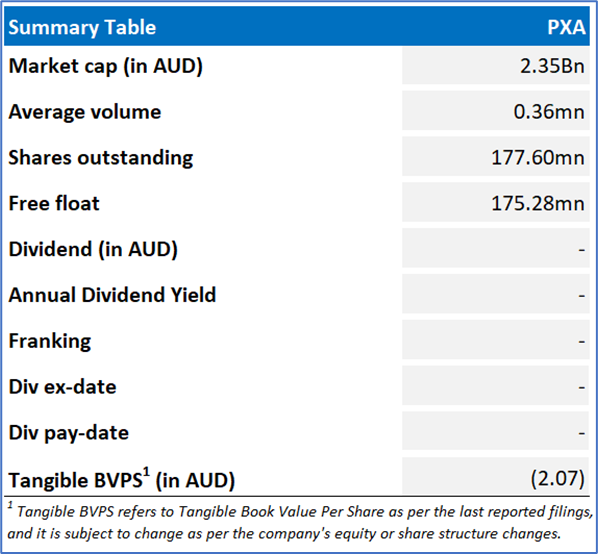
PEXA Group Limited (ASX: PXA) provides a digital property settlement platform in Australia, operating through three segments: Exchange, International, and Digital Solutions. Its cloud-based Electronic Lodgement Network streamlines property transactions by enabling digital lodgement, settlement, and collaboration across the property ecosystem.
Recommendation Rationale – SELL at AUD 13.53
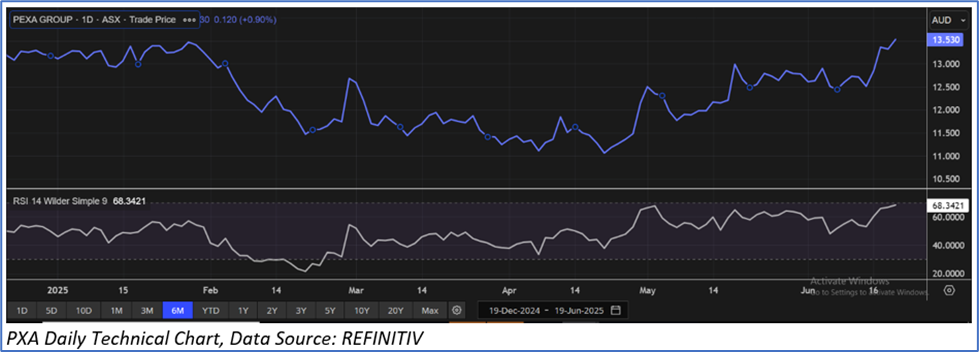
- Surpassed Resistance: PXA’s share price surpassed its R1 level, recommended on 13 May 2025. Therefore, PXA can face correction at the current levels.
- Overvalued Multiples: On a forward 12-month basis, the stock is trading at an EV/Sales multiple of 5.9x vs industry (Software & IT Services) average of 4.4x.
- Increase in Losses: In 1HFY25, the company incurred a net loss after tax of AUD 32.7 million, compared to a loss of AUD 4.6 million in the same period last year. The company’s loss-making position presents a risk, as continued financial losses may strain resources, limit growth opportunities, and require additional funding or capital raising to sustain operations.
- Emerging Risks: The Group’s ability to secure funding is influenced by volatility in capital and debt markets. Furthermore, its operations are subject to stringent environmental regulations. Limited access to liquidity could impact PXA’s ability to operate efficiently, as adequate funding is essential to support ongoing business activities.
PXA Daily Chart
Valuation Methodology: EV/Sales Approach (FY June'26E) (Illustrative)
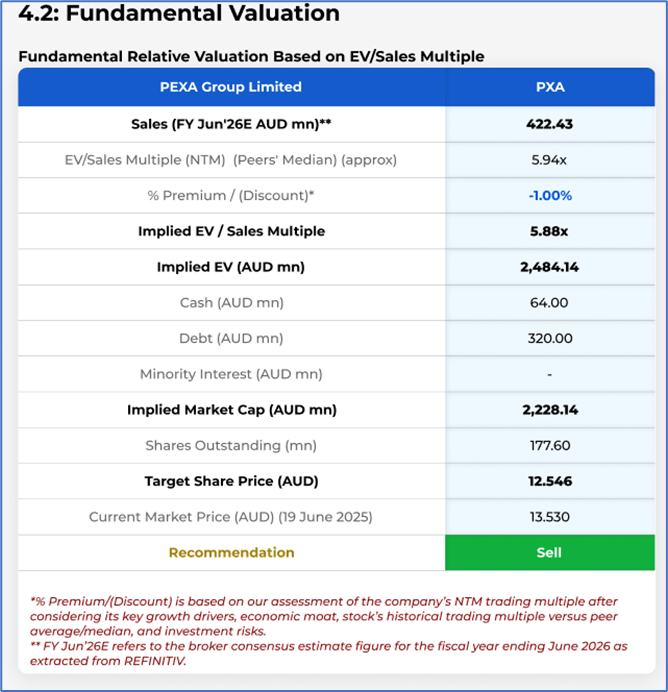
Stock might trade at a slight discount to its peers, considering the impact of changing global tariffs, ongoing softness in the UK remortgage market, etc. Peers include James Hardie Industries PLC (ASX: JHX), Centuria Capital Group (ASX: CNI), Charter Hall Group (ASX: CHC), and others
Considering that the stock has surpassed its R1 level, share price movement, current trading level, and risks associated, the share price can face consolidation at the current levels. Hence, a ‘Sell’ recommendation is given on the stock at the current price of AUD 13.530 (as of 19 June 2025, at 10:30 AM AEST).
Markets are trading in a highly volatile zone currently due to certain macro-economic issues and geopolitical issues prevailing geopolitical tensions. Therefore, it is prudent to follow a cautious approach while investing.
Note 1: Past performance is neither an indicator nor a guarantee of future performance.
Note 2: The reference date for all price data, currency, technical indicators, support, and resistance levels is 19 June 2025. The reference data in this report has been partly sourced from REFINITIV.
Note 3: Investment decisions should be made depending on an individual's appetite for upside potential, risks, holding duration, and any previous holdings. An 'Exit' from the stock can be considered if the Target Price mentioned as per the Valuation and or the technical levels provided has been achieved and is subject to the factors discussed above.
Note 4: Kalkine reports are prepared based on the stock prices captured either from REFINITIV or Trading View. Typically, REFINITIV or Trading View may reflect stock prices with a delay which could be a lag of 25-30 minutes. There can be no assurance that future results or events will be consistent with the information provided in the report. The information is subject to change without any prior notice.
Technical Indicators Defined: -
Support: A level at which the stock prices tend to find support if they are falling, and a downtrend may take a pause backed by demand or buying interest. Support 1 refers to the nearby support level for the stock and if the price breaches the level, then Support 2 may act as the crucial support level for the stock.
Resistance: A level at which the stock prices tend to find resistance when they are rising, and an uptrend may take a pause due to profit booking or selling interest. Resistance 1 refers to the nearby resistance level for the stock and if the price surpasses the level, then Resistance 2 may act as the crucial resistance level for the stock.
Stop-loss: It is a level to protect further losses in case of unfavourable movement in the stock prices.

 Please wait processing your request...