This report is an updated version of the report published on 5 September 2025 at 11:20 AM AEST.
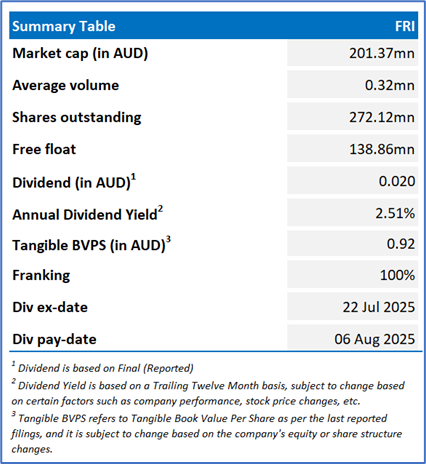
Finbar Group Limited (ASX: FRI)
FRI operates as a property development and investment company with a focus on medium to high-density residential and commercial buildings in Western Australia.
Recommendation Rationale – SELL at AUD 0.820
- Financial Highlights: FRI’s results from operating activities decreased to AUD 21.36mn in FY25 vs AUD 26.27mn in FY24. Despite topline growth operating income decreased due to increased administrative expenses and rental expenses during the period. Profit for the year was down to AUD 14.38mn in FY25 vs AUD 16.60mn in FY24.
- Surpassed Resistance: FRI stock has surpassed its R2 level recommended on 05 August 2025. Therefore, share price can face resistance at the current levels.
- Overvalued Multiples: On a Trailing 12-month basis – key trading multiples (EV/EBITDA, Price/Earnings,) are higher than median of the Consumer Cyclicals sector.
- Market Risk: As a property developer, Finbar’s core business is highly sensitive to changes in the residential real estate market (such as regulatory, interest rate, or demand shocks), which could quickly affect revenue and project viability.
- Technical Commentary: After a rally, FRI’s stock price is approaching its previous peak, anticipating a potential correction. Moreover, the momentum oscillator RSI (14-period) is trading in its overbought territory, adding further evidence to the previous observation. Prices are trading above both trend-following indicators 21-day and 50-day SMAs, which might function as dynamic support levels for the stock; in contrast, the stock’s previous high may act as a resistance level.
FRI’s Daily Price Chart
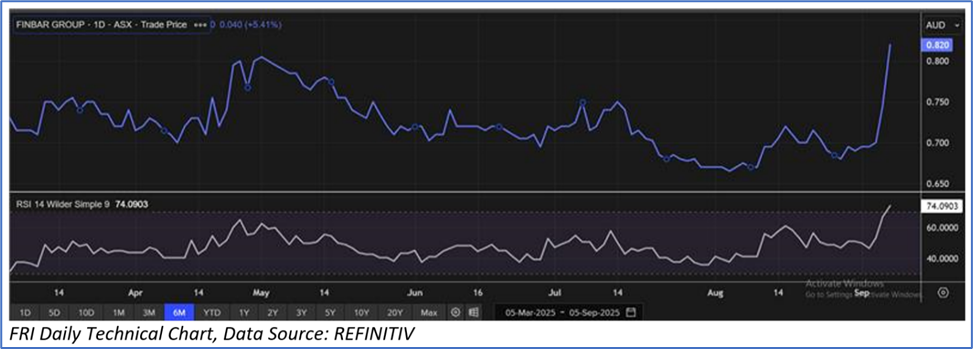
Considering that the stock has surpassed its R2 level, macroeconomic uncertainty, share price movement, current trading level, and risks associated, the share price can face consolidation at the current levels. Hence, a ‘Sell’ recommendation is given on the stock at the current market price of AUD 0.820, at 10:30 AM AEST, as of 5 September 2025.
Markets are trading in a highly volatile zone currently due to certain macro-economic issues and geopolitical issues prevailing geopolitical tensions. Therefore, it is prudent to follow a cautious approach while investing.
Note 1: Past performance is neither an indicator nor a guarantee of future performance.
Note 2: The reference date for all price data, currency, technical indicators, support, and resistance levels is 5 September 2025. The reference data in this report has been partly sourced from REFINITIV.
Note 3: Investment decisions should be made depending on an individual's appetite for upside potential, risks, holding duration, and any previous holdings. An 'Exit' from the stock can be considered if the Target Price mentioned as per the Valuation and or the technical levels provided have been achieved and is subject to the factors discussed above.
Note 4: Kalkine reports are prepared based on the stock prices captured either from REFINITIV or Trading View. Typically, REFINITIV or Trading View may reflect stock prices with a delay which could be a lag of 25-30 minutes. There can be no assurance that future results or events will be consistent with the information provided in the report. The information is subject to change without any prior notice.
Note 5: Dividend Yield may vary as per the stock price movement.
Technical Indicators Defined: -
Support: A level at which the stock prices tend to find support if they are falling, and downtrend may take a pause backed by demand or buying interest.
Resistance: A level at which the stock prices tend to find resistance when they are rising, and uptrend may take a pause due to profit booking or selling interest.
Stop-loss: In general, it is a level to protect further losses in case of any unfavourable movement in the stock prices.

 Please wait processing your request...