This report is an updated version of the report published on 19 February 2025 at 3:55 PM AEDT.
Fletcher Building Limited (NZX: FBU)
Fletcher Building Limited (NZX: FBU) is a leading provider of building products and solutions based in New Zealand. Its segments include Building Products, Distribution, Concrete, Australia, Residential and Development, and Construction. Building Products segment is a manufacturer, distributor and marketer of building products used in the residential, industrial, and commercial markets in New Zealand.
Recommendation Rationale – SELL at NZD 3.46
- Bottom of Form
- Overvalued Multiples: On a forward 12-month basis, the stock is trading at a Price/Cash flow multiple of 8.1x vs industry (Consumer Cyclicals) median of 7.5x.
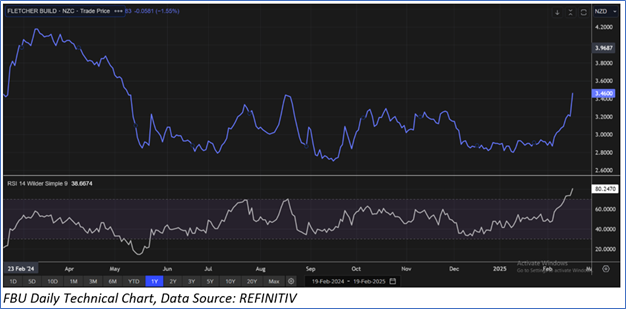
- Trading Around Resistance:FBU’s share price surpassed its R1 level recommended on 3 February 2025.
- Declining Financials: Revenue fell by 7.2% year-on-year in the first half of FY25, totalling NZD 3.58 billion. The company incurred a loss of NZD 134 million in 1HFY25, compared to a loss of NZD 120 million in 1HFY24.
- Emerging Risks: The company faces risks associated with unforeseen fluctuations in equity and debt markets. FBU is particularly exposed to performance risks, primarily linked to its capacity to meet market forecasts, achieve superior risk-adjusted returns compared to industry benchmarks, and complete developments as planned. Additionally, risks related to foreign currency fluctuations and changes in government regulations could impact the company’s business model.
FBU Daily Chart
Valuation Methodology: P/BV Approach (FY June'25E) (Illustrative)
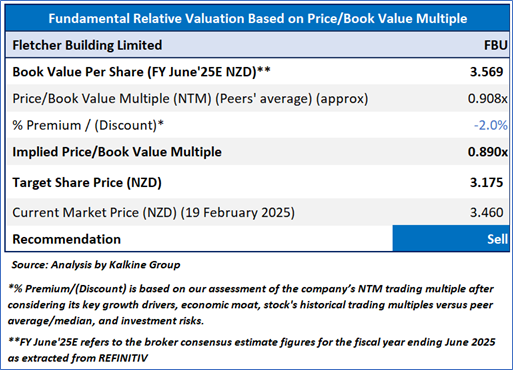
Given the decline in revenue and losses in 1HFY25, inflationary pressure, rising interest rates, intense competition, etc., the stock might trade at a slight discount to its peers. For valuation, few peers like Port of Tauranga Ltd (NZX: POT), Steel & Tube Holdings Ltd (NZX: STU), and others have been considered. Considering that the stock has surpassed its R1 level, rally in share price, current trading level, and risks associated, the share price can face consolidation at the current levels. Hence, a ‘Sell’ recommendation is given on the stock at the current price of NZD 3.46 (New Zealand Time: 12:05 PM (GMT +13)) as on 19 February 2025.
Note: This report may be updated with details around fundamental and technical analysis, price/ chart in due course, as appropriate.
Note 1: Past performance is neither an indicator nor a guarantee of future performance.
Note 2: The reference date for all price data, currency, technical indicators, support, and resistance levels is 19 February 2025. The reference data in this report has been partly sourced from REFINITIV.
Note 3: Investment decisions should be made depending on an individual's appetite for upside potential, risks, holding duration, and any previous holdings. An 'Exit' from the stock can be considered if the Target Price mentioned as per the Valuation and or the technical levels provided has been achieved and is subject to the factors discussed above.
Note 4: Kalkine reports are prepared based on the stock prices captured either from REFINITIV or Trading View. Typically, REFINITIV or Trading View may reflect stock prices with a delay which could be a lag of 25-30 minutes. There can be no assurance that future results or events will be consistent with the information provided in the report. The information is subject to change without any prior notice.
Technical Indicators Defined: -
Support: A level at which the stock prices tend to find support if they are falling, and a downtrend may take a pause backed by demand or buying interest. Support 1 refers to the nearby support level for the stock and if the price breaches the level, then Support 2 may act as the crucial support level for the stock.
Resistance: A level at which the stock prices tend to find resistance when they are rising, and an uptrend may take a pause due to profit booking or selling interest. Resistance 1 refers to the nearby resistance level for the stock and if the price surpasses the level, then Resistance 2 may act as the crucial resistance level for the stock.
Stop-loss: It is a level to protect further losses in case of unfavourable movement in the stock prices.

 Please wait processing your request...