This report is an updated version of the report published on 10 July 2025 at 12:19 pm AEST.
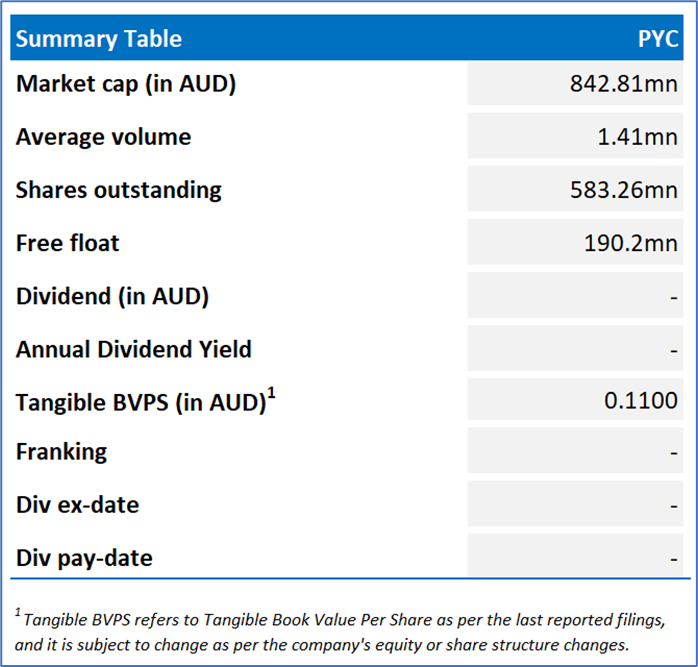
PYC Therapeutics Limited (ASX: PYC)
PYC is a clinical-stage biotechnology company focused on developing precision RNA therapies for genetic diseases with no current treatments. Using its proprietary drug delivery platform, PYC enhances the potency of RNA medicines targeting monogenic diseases. The company aims to transform patient lives by advancing its therapies within the rapidly growing RNA therapeutics field.
Recommendation Rationale – SELL at AUD 1.470
- Increase in Losses: PYC’s net loss increased 69% YoY in 1HFY25. The company’s loss-making position presents a risk, as continued financial losses may strain resources, limit growth opportunities, and require additional funding or capital raising to sustain operations.
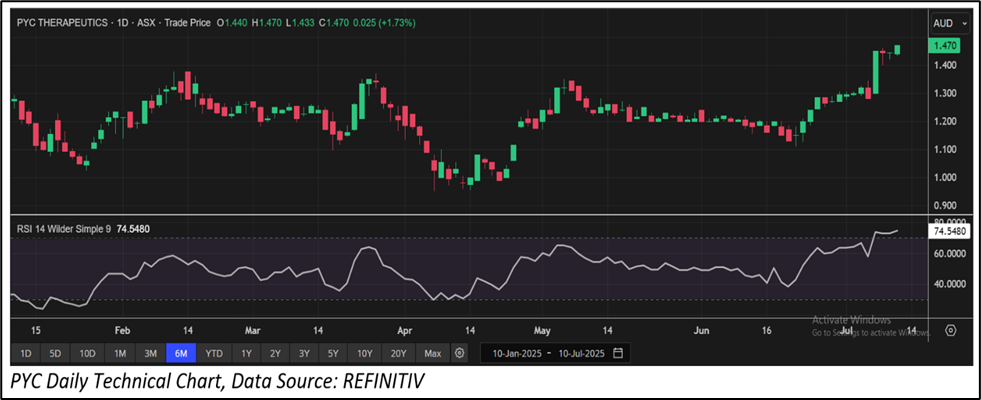
- Trading Near the Resistance: PYC's share price has surpassed its R1 level and is now approaching its R2 level, as recommended on 2 July 2025. Therefore, share price can face resistance at the current levels.
- Overvalued Multiples: On a forward 12-month basis - key valuation multiples (EV/Sales, and Price/Book Value) are higher than median of the Healthcare Sector.
Emerging Risks: PYC Therapeutics is a pre-revenue biotech firm whose future depends heavily on the clinical success of its drug candidates, particularly its lead asset, VP-001. Any failure in human trials could severely impact the company’s valuation and long-term prospects. Additionally, by opting to retain full ownership of its pipeline rather than pursuing commercial partnerships, PYC may preserve potential upside but also faces increased execution risk and potential delays in bringing therapies to market.
- Technical Standpoint: The momentum oscillator, 14-day RSI (~74.54) is approaching the overbought zone; and thus, price can face consolidation in the short term.
PYC’s Daily Price Chart
Valuation Methodology: EV/Sales Approach (FY June'26E) (Illustrative)
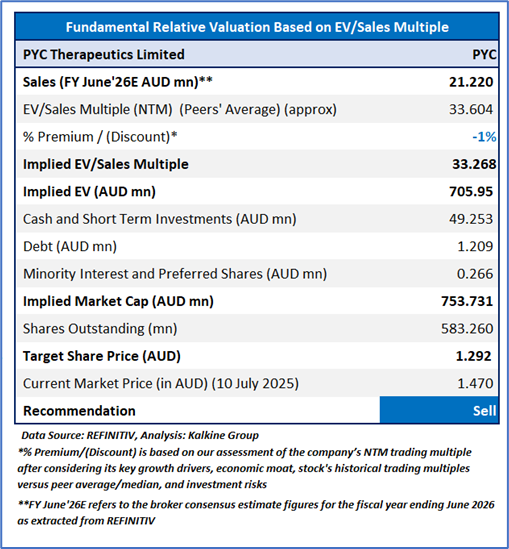
Stock might trade at a slight discount to its peers considering the YoY increase in net loss in 1HFY25, increase in total debt, and regulatory clinical uncertainty. For conducting the valuation, the following peers have been considered: Mesoblast Ltd (ASX: MSB), Immutep Ltd (ASX: IMM), Orthocell Ltd (ASX: OCC), and others.
Considering that the stock is approaching its R2 level, macroeconomic uncertainty, share price movement, current trading level, and risks associated, the share price can face consolidation at the current levels. Hence, a ‘Sell’ recommendation is given on the stock at the current price of AUD 1.470 (as of 10 July 2025, at 11:35 AM AEST).
Markets are trading in a highly volatile zone currently due to certain macro-economic issues and geopolitical issues prevailing geopolitical tensions. Therefore, it is prudent to follow a cautious approach while investing.
Note 1: Past performance is neither an indicator nor a guarantee of future performance.
Note 2: The reference date for all price data, currency, technical indicators, support, and resistance levels is 10 July 2025. The reference data in this report has been partly sourced from REFINITIV.
Note 3: Investment decisions should be made depending on an individual's appetite for upside potential, risks, holding duration, and any previous holdings. An 'Exit' from the stock can be considered if the Target Price mentioned as per the Valuation and or the technical levels provided has been achieved and is subject to the factors discussed above.
Note 4: Kalkine reports are prepared based on the stock prices captured either from REFINITIV or Trading View. Typically, REFINITIV or Trading View may reflect stock prices with a delay which could be a lag of 25-30 minutes. There can be no assurance that future results or events will be consistent with the information provided in the report. The information is subject to change without any prior notice.
Technical Indicators Defined: -
Support: A level at which the stock prices tend to find support if they are falling, and downtrend may take a pause backed by demand or buying interest.
Resistance: A level at which the stock prices tend to find resistance when they are rising, and uptrend may take a pause due to profit booking or selling interest.
Stop-loss: In general, it is a level to protect further losses in case of any unfavourable movement in the stock prices.

 Please wait processing your request...