This report is an updated version of the report published on 23 April 2025 at 11:33 am AEST.
AVITA Medical, Inc. (ASX: AVH) is a regenerative medicine company aiming to revolutionize wound care management and skin restoration with its innovative devices. Its portfolio includes the FDA-approved RECELL® System, designed for treating thermal burn wounds, full-thickness skin defects, and repigmenting stable depigmented vitiligo lesions.
Recommendation Rationale – SELL at AUD 3.050
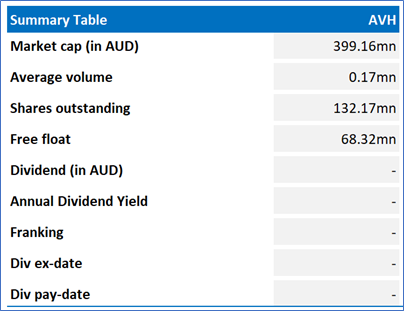
- Financial Highlights: AVH saw a 98% YoY drop in other income to USD 0.16mn in FY24 vs USD 9.91mn in 1HFY23. Total operating expenses rose 29% YoY to USD 111.8mn in FY24 vs USD 86.4mn in FY23, driven by higher salaries, stock compensation, commissions, and travel. Consequently, the loss attributable to owners increased 75% YoY to USD 61.85mn in FY24 vs USD 35.38mn in FY23.
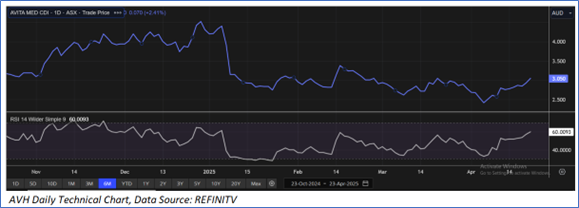
- Trading Near the Resistance: AVH stock has surpassed its R1 level recommended on 14 March 2025. Therefore, share price can face resistance at the current levels.
- Market Risk: Delays in Reaching Agreement with CROs and Trial Sites: This poses a significant risk to AVH's timelines for product development and regulatory approvals. If they cannot finalize contracts with Clinical Research Organizations (CROs) and clinical trial sites on terms that are agreeable to both parties, it will inevitably delay the initiation and progression of their clinical trials. This can push back potential product launches and impact their competitive positioning.
AVH’s Daily Price Chart
Valuation Methodology: EV/Sales Approach (FY December'25E) (Illustrative)
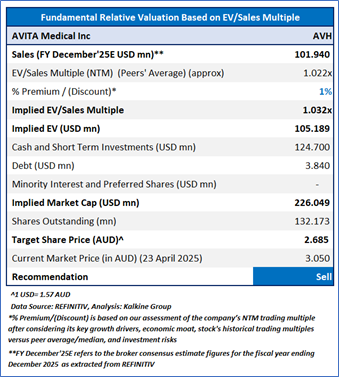
Stock might trade at a slight premium to its peers considering the revenue growth in FY24, successful market penetration, improved gross profit margin in FY24, investment in medical science liaisons. For conducting the valuation, the following peers have been considered: Radiopharm Theranostics Ltd (ASX: RAD), MedAdvisor Ltd (ASX: MDR), and ImExHS Ltd (ASX: IME) have been considered.
Considering that the stock has surpassed its R1 level, macroeconomic uncertainty, current trading level, and risks associated, the share price can face consolidation at the current levels. Hence, a ‘Sell’ recommendation is given on the stock at the current price of AUD 3.050 (as of 23 April 2025, at 10:54 AM AEST).
Markets are trading in a highly volatile zone currently due to certain macro-economic issues and geopolitical issues prevailing geopolitical tensions. Therefore, it is prudent to follow a cautious approach while investing.
Note 1: Past performance is neither an indicator nor a guarantee of future performance.
Note 2: The reference date for all price data, currency, technical indicators, support, and resistance levels is 23 April 2025. The reference data in this report has been partly sourced from REFINITIV.
Note 3: Investment decisions should be made depending on an individual's appetite for upside potential, risks, holding duration, and any previous holdings. An 'Exit' from the stock can be considered if the Target Price mentioned as per the Valuation and or the technical levels provided have been achieved and is subject to the factors discussed above.
Note 4: Kalkine reports are prepared based on the stock prices captured either from REFINITIV or Trading View. Typically, REFINITIV or Trading View may reflect stock prices with a delay which could be a lag of 25-30 minutes. There can be no assurance that future results or events will be consistent with the information provided in the report. The information is subject to change without any prior notice.
Technical Indicators Defined: -
Support: A level at which the stock prices tend to find support if they are falling, and downtrend may take a pause backed by demand or buying interest.
Resistance: A level at which the stock prices tend to find resistance when they are rising, and uptrend may take a pause due to profit booking or selling interest.
Stop-loss: In general, it is a level to protect further losses in case of any unfavourable movement in the stock prices.

 Please wait processing your request...