NIKE Inc
NIKE Inc (NYSE: NKE) designs, markets, and distributes athletic footwear, apparel, equipment, accessories, and related services for sports and fitness. The company operates through four main geographic segments: North America, Europe, Middle East & Africa (EMEA), Greater China, and Asia Pacific & Latin America (APLA).
_06_27_2025_13_51_51_211081.jpg)
Key Financial Updates:
- Fiscal Year 2025 Revenue Performance: NIKE, Inc. reported full-year revenues of USD 46.3 billion for the fiscal year ended May 31, 2025, representing a decline of 10% on a reported basis and 9% on a currency-neutral basis compared to the previous fiscal year. Revenues from the NIKE Brand totaled USD 44.7 billion, down 9% year-over-year across all geographies. NIKE Direct revenues declined by 13% to USD 18.8 billion, driven by a significant 20% drop in NIKE Brand Digital, while NIKE-owned store sales remained flat. Wholesale revenues decreased 7% to USD 25.9 billion, while Converse generated USD 1.7 billion in revenue, down 19%, with sales weakening across all regions.
- Margin Pressure and Profitability Trends: NIKE’s gross margin for the fourth quarter contracted by 440 basis points to 40.3%, primarily due to increased discounting and unfavorable shifts in channel mix. For the full year, gross margin fell 190 basis points to 42.7%, influenced by higher discounts, increased inventory obsolescence reserves, and mix changes, though partially mitigated by lower product costs. These pressures translated into a full-year net income of USD 3.2 billion, down 44%, and diluted earnings per share of USD 2.16, a 42% decline. Fourth-quarter net income was USD 0.2 billion, reflecting an 86% decrease year-over-year, with earnings per share at USD 0.14.
- Cost Management: For the year, selling and administrative expenses declined by 3% to USD 16.1 billion. Operating overhead expenses dropped 7% to USD 11.4 billion due to the absence of prior-year restructuring charges and reductions in wage-related and administrative costs. However, demand creation expenses increased 9% to USD 4.7 billion, driven by higher investments in brand and sports marketing. Similarly, in Q4, demand creation rose 15% year-over-year to USD 1.3 billion, while operating overhead fell 3%.
- Balance Sheet Overview: As of May 31, 2025, NIKE’s inventories stood at USD 7.5 billion, roughly unchanged from the previous year. The company’s cash, equivalents, and short-term investments totaled USD 9.2 billion, down by approximately USD 2.4 billion. This reduction was primarily attributed to continued capital returns to shareholders, bond repayments, and capital expenditures, exceeding the cash generated from operations.
- Shareholder Returns and Strategic Direction: NIKE maintained its strong track record of returning capital to shareholders, marking 23 consecutive years of dividend increases. During Q4, the company returned USD 0.8 billion, comprising USD 591 million in dividends (up 6%) and USD 202 million in share repurchases. For the full fiscal year, NIKE returned USD 5.3 billion; USD 2.3 billion in dividends and USD 3.0 billion in share buybacks under the ongoing four-year, USD 18 billion repurchase program. Looking ahead, management is optimistic about fiscal 2026, emphasizing the “Win Now” strategy and a newly launched “sport offense” realignment to drive future growth through enhanced focus on sport-led engagement, a complete product offering, and marketplace elevation.
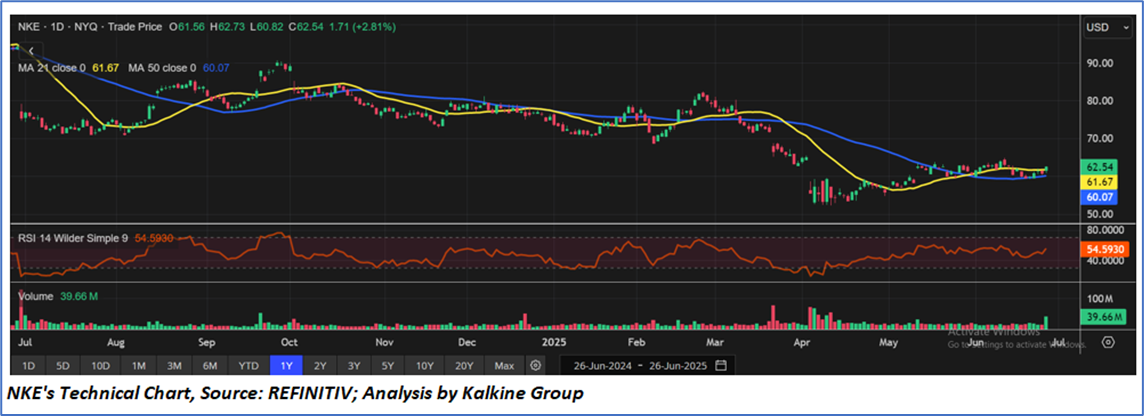
Technical Observation (on the daily chart):
NKE appears to be stabilizing after a prolonged downtrend, with a recent bullish crossover of the 21-day and 50-day moving averages. With the stock recently closing above both its 21-day and 50-day moving averages indicates early bullish momentum. The RSI at 54.6 suggests improving strength without overbought conditions, while rising volume supports the recent upward move.
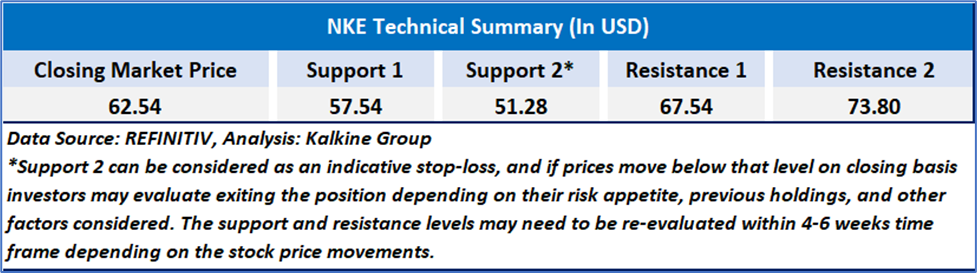
As per the above-mentioned price action, recent key business and financial updates, momentum in the stock over the last month, and technical indicators analysis, a ‘Buy’ rating has been given to NIKE, Inc (NYSE: NKE) at the closing market price of USD 62.54 as of June 26,2025.
Individuals can evaluate the stock based on the support and resistance levels provided in the report in case of keen interest taking into consideration the risk-reward scenario.
Markets are trading in a highly volatile zone currently due to certain macro-economic issues and prevailing geopolitical tensions. Therefore, it is prudent to follow a cautious approach while investing.
Related Risk: This report may be looked at from a high-risk perspective and a recommendation is provided for a short duration. This report is solely based on technical parameters, and the fundamental performance of the stocks has not been considered in the decision-making process. Other factors which could impact the stock prices include market risks, regulatory risks, interest rates risks, currency risks, social and political instability risks etc.
Note 1: Past performance is not a reliable indicator of future performance.
Note 2: The reference date for all price data, currency, technical indicators, support, and resistance level is June 26,2025. The reference data in this report has been partly sourced from REFINITIV.
Note 3: Investment decisions should be made depending on an individual's appetite for upside potential, risks, holding duration, and any previous holdings. An 'Exit' from the stock can be considered if the Target Price mentioned as per the Valuation and or the technical levels provided has been achieved and is subject to the factors discussed above.
Note 4: Target Price refers to a price level that the stock is expected to reach as per the relative valuation method and or technical analysis taking into consideration both short-term and long-term scenarios.
Note 5: ‘Kalkine reports are prepared based on the stock prices captured either from the New York Stock Exchange (NYSE), NASDAQ Capital Markets (NASDAQ), and or REFINITIV. Typically, all sources (NYSE, NASDAQ, or REFINITIV) may reflect stock prices with a delay which could be a lag of 15-20 minutes. There can be no assurance that future results or events will be consistent with the information provided in the report. The information is subject to change without any prior notice.

 Please wait processing your request...