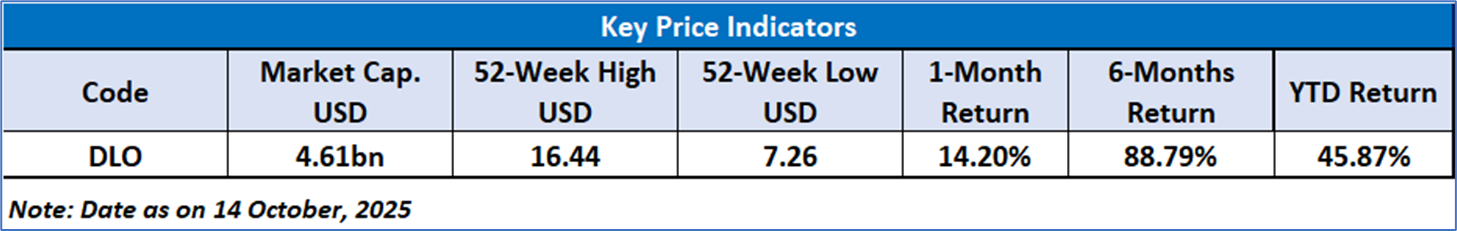
DLocal Ltd
DLocal Ltd (NASDAQ: DLO) headquartered in Uruguay, specializes in providing global merchants with access to consumers in emerging markets. The company operates a technology-driven payments platform designed to facilitate seamless transactions and cross-border payment solutions across developing economies.
Key Business Updates
- Strong Operational Momentum and Continued Growth: DLocal Limited (NASDAQ: DLO) reported another quarter of robust operational performance for the three months ended June 30, 2025, underscoring its position as a leading technology-driven payments platform. The company achieved record levels of Total Payment Volume (TPV), revenues, and profitability metrics, reflecting disciplined execution and consistent expansion across key markets. Management highlighted these results as evidence of DLocal’s scalable, high-margin, and cash-generative business model, which continues to deliver substantial value to its global merchant base.
- Record TPV and Revenue Expansion: Total Payment Volume reached a record USD 9.2 billion, marking a 53% year-over-year increase from USD 6.0 billion in Q2 2024 and a 14% sequential rise from Q1 2025. In constant currency, TPV growth would have reached 65% year-over-year. Revenues grew 50% year-over-year to USD 256.5 million, supported by a higher share of pay-ins and strong performance in core markets such as Brazil and Argentina. Revenue growth outpaced TPV due to improved volume composition, though partially offset by reduced FX spreads in Egypt following a currency devaluation and partial volume loss from a key merchant.
- Profitability Driven by Regional Diversification: Gross profit increased 42% year-over-year to USD 98.9 million, benefiting from operational efficiencies and regional diversification. Brazil contributed significantly through higher installment payment volumes and recovery of prior processing costs, while Argentina delivered strong volume growth that offset lower FX spreads. South Africa also performed well, supported by reduced processing costs. However, profitability was partially constrained by retry costs in Chile and Colombia. The gross profit margin stood at 39%, compared with 41% a year earlier, reflecting a slightly more competitive pricing environment.
- Expanding Operating Income and Margin Efficiency: Operating profit surged 85% year-over-year to USD 55.8 million, driven by top-line growth and operational leverage, despite a 9% increase in operating expenses linked to technology investments and headcount expansion. Adjusted EBITDA rose 64% year-over-year to USD 70.1 million, translating into a 27% Adjusted EBITDA margin, up two percentage points from the prior-year period. The ratio of Adjusted EBITDA to gross profit reached 71%, marking the fifth consecutive quarter of margin improvement and underscoring disciplined cost management.
- Net Income Moderation Due to Market Volatility: Net income for the quarter totaled USD 42.8 million, or USD 0.14 per diluted share, representing a 7% decline year-over-year, primarily impacted by the devaluation of the Argentine peso and related revaluation of the company’s bond portfolio. The firm strategically reduced its exposure to Argentina by over 80%, reallocating capital into U.S. Treasury securities. The effective tax rate increased to 16%, up from 10% in the previous quarter, reflecting a greater share of local-to-local pre-tax income. Despite currency headwinds, core operational profitability remained resilient.
- Robust Liquidity and Free Cash Flow Generation: Free cash flow reached USD 48.4 million, a 156% year-over-year increase, supported by stronger operational earnings and efficient working capital management. As of June 30, 2025, total cash and cash equivalents stood at USD 476.9 million, of which USD 253.8 million represented corporate cash. This figure declined sequentially from USD 355.9 million in March 2025, primarily due to the USD 150 million dividend payout during the quarter, highlighting the company’s ability to return capital while maintaining a solid liquidity position.
- Strategic Governance and Forward-Looking Outlook: The company announced governance enhancements, including transitioning to a majority independent Board and forming dedicated Nominating & Corporate Governance and Compensation Committees. Additionally, DLocal will cancel existing treasury shares to optimize capital structure and reinforce shareholder value creation. For full-year 2025, management guided to 40–50% TPV growth, 30–40% revenue growth, and 40–50% Adjusted EBITDA growth, while maintaining caution toward macroeconomic, trade, and FX risks in key emerging markets such as Brazil, Mexico, Argentina, and Egypt. The company remains confident in sustaining its growth trajectory through operational excellence and prudent financial discipline.
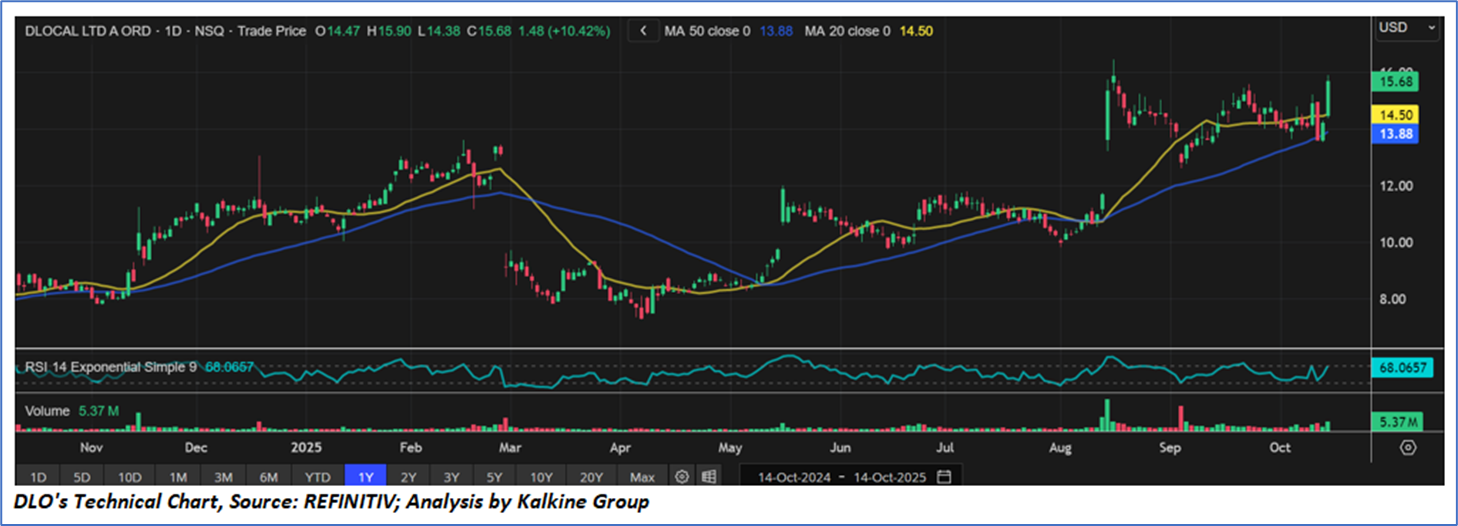
Technical Observation (on the daily chart):
DLocal Ltd’s stock shows strong bullish momentum, gaining over 10% to close at USD 15.68, supported by a breakout above its 20-day and 50-day moving averages. The rising trend is reinforced by higher trading volumes and an RSI near 68, indicating strong buying interest but nearing overbought territory.
DLocal Limited delivered another strong quarter in Q2 2025, showcasing solid operational execution and sustained financial growth. The company achieved record TPV of USD 9.2 billion and revenue of USD 256.5 million, reflecting robust demand and expanding merchant activity across key markets. Profitability remained resilient, with Adjusted EBITDA rising 64% year-over-year and margins improving amid disciplined cost management. Despite currency headwinds in Argentina and Egypt, free cash flow more than doubled, and the balance sheet remained strong with ample liquidity. Backed by enhanced governance initiatives and confident full-year guidance, DLocal continues to demonstrate healthy growth momentum and operational strength, reinforcing its position as a leading emerging-market payments platform.
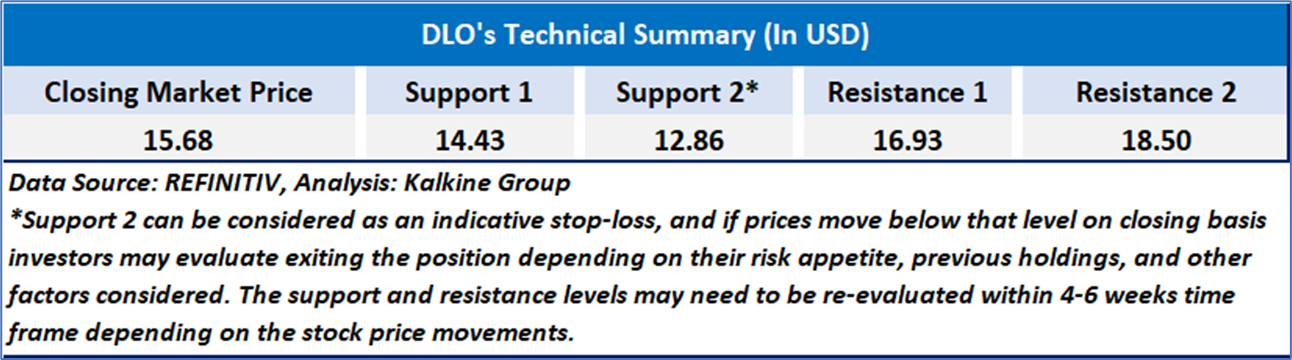
As per the above-mentioned price action, recent key business and financial updates, momentum in the stock over the last month, and technical indicators analysis, a ‘Buy’ rating has been given to DLocal Ltd (NASDAQ: DLO) at the closing market price of USD 15.68 as of Oct 14,2025.
Individuals can evaluate the stock based on the support and resistance levels provided in the report in case of keen interest taking into consideration the risk-reward scenario.
Markets are trading in a highly volatile zone currently due to certain macro-economic issues and prevailing geopolitical tensions. Therefore, it is prudent to follow a cautious approach while investing.
Related Risk: This report may be looked at from a high-risk perspective and a recommendation is provided for a short duration. This report is solely based on technical parameters, and the fundamental performance of the stocks has not been considered in the decision-making process. Other factors which could impact the stock prices include market risks, regulatory risks, interest rates risks, currency risks, social and political instability risks etc.
Note 1: Past performance is not a reliable indicator of future performance.
Note 2: The reference date for all price data, currency, technical indicators, support, and resistance level is October 14,2025. The reference data in this report has been partly sourced from REFINITIV.
Note 3: Investment decisions should be made depending on an individual's appetite for upside potential, risks, holding duration, and any previous holdings. An 'Exit' from the stock can be considered if the Target Price mentioned as per the Valuation and or the technical levels provided has been achieved and is subject to the factors discussed above.
Note 4: Target Price refers to a price level that the stock is expected to reach as per the relative valuation method and or technical analysis taking into consideration both short-term and long-term scenarios.
Note 5: ‘Kalkine reports are prepared based on the stock prices captured either from the New York Stock Exchange (NYSE), NASDAQ Capital Markets (NASDAQ), and or REFINITIV. Typically, all sources (NYSE, NASDAQ, or REFINITIV) may reflect stock prices with a delay which could be a lag of 15-20 minutes. There can be no assurance that future results or events will be consistent with the information provided in the report. The information is subject to change without any prior notice.

 Please wait processing your request...