
SoFi Technologies Inc
SoFi Technologies, Inc. (NASDAQ: SOFI) is a member-centric, one-stop shop for digital financial services. The Company, through its lending and financial services products, allows members to borrow, save, spend, invest and protect their money. The Company's segments include Lending, Technology Platform and Financial Services.
Key Business and Financial Updates:
Technical Observation (on the daily chart):
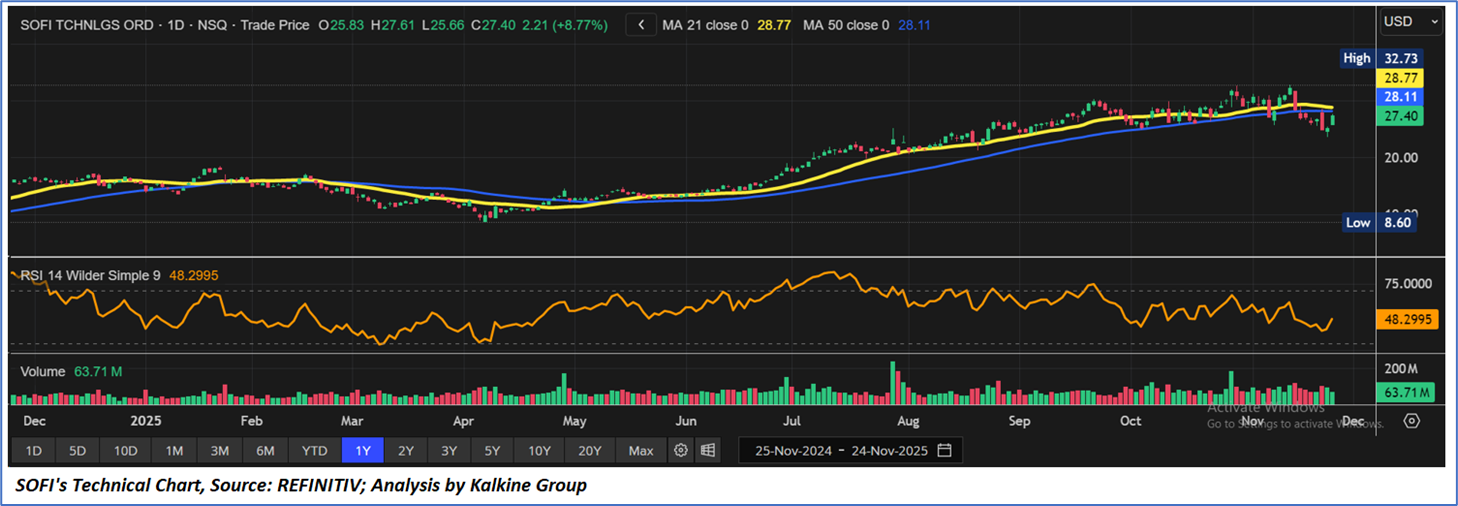
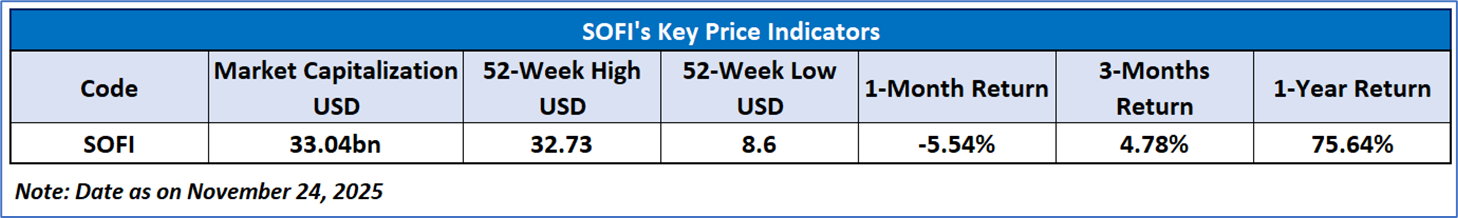
SoFi Technologies, Inc. (NASDAQ: SOFI) reported a notably strong operating and financial performance, highlighted by record quarterly GAAP net revenue of USD 961.6 million (+38% YoY), net income of USD 139.4 million (+129% YoY), and adjusted EBITDA of USD 276.9 million, alongside continued expansion in membership to 12.6 million (+35% YoY) and total products to 18.6 million (+36% YoY). Lending originations grew to USD 9.9 billion (+57% YoY) across personal, student, and home loans, supported by robust capital-markets execution and resilient credit metrics, while fee-based revenue and the Technology Platform contributed steadily to diversification efforts. Management raised full-year 2025 guidance across revenue, EBITDA, net income, and EPS, reflecting strong momentum across the ecosystem and broadening monetization channels. Technically, the stock is stabilizing after a pullback, trading near support at USD 26–27 with an RSI around neutral levels, and the overall trend remains constructive so long as price reclaims key moving averages and maintains its higher-lows structure.
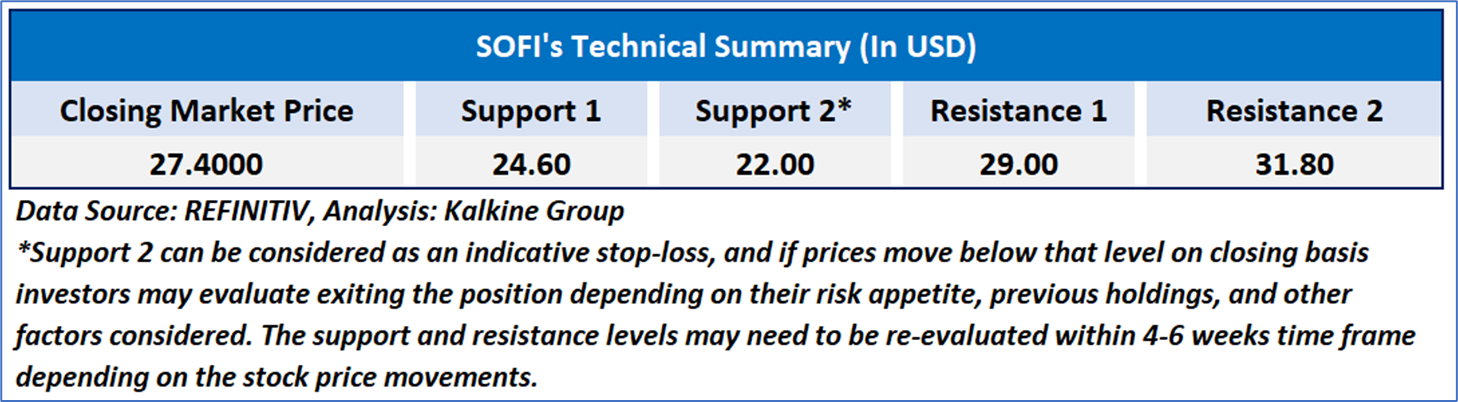
As per the above-mentioned price action, important support near USD 24.00-USD 26.00, momentum in the stock over the last month, and technical indicators analysis, a ‘WATCH’ rating has been given for SoFi Technologies, Inc. (NASDAQ: SOFI) at the closing price of USD 27.40, as of November 24, 2025.
Individuals can evaluate the stock based on the support and resistance levels provided in the report in case of keen interest taking into consideration the risk-reward scenario.
Markets are trading in a highly volatile zone currently due to certain macro-economic issues and prevailing geopolitical tensions. Therefore, it is prudent to follow a cautious approach while investing.
Related Risk: This report may be looked at from a high-risk perspective, and a recommendation is provided for a short duration. This report is solely based on technical parameters, and the fundamental performance of the stocks has not been considered in the decision-making process. Other factors which could impact the stock prices include market risks, regulatory risks, interest rates risks, currency risks, social and political instability risks etc.
Note 1: Past performance is not a reliable indicator of future performance.
Note 2: The reference date for all price data, currency, technical indicators, support, and resistance level is November 24, 2025. The reference data in this report has been partly sourced from REFINITIV.
Note 3: Investment decisions should be made depending on an individual's appetite for upside potential, risks, holding duration, and any previous holdings. An 'Exit' from the stock can be considered if the Target Price mentioned as per the Valuation and or the technical levels provided has been achieved and is subject to the factors discussed above.
Note 4: Target Price refers to a price level that the stock is expected to reach as per the relative valuation method and or technical analysis taking into consideration both short-term and long-term scenarios.
Note 5: ‘Kalkine reports are prepared based on the stock prices captured either from the New York Stock Exchange (NYSE), NASDAQ Capital Markets (NASDAQ), and or REFINITIV. Typically, all sources (NYSE, NASDAQ, or REFINITIV) may reflect stock prices with a delay which could be a lag of 15-20 minutes. There can be no assurance that future results or events will be consistent with the information provided in the report. The information is subject to change without any prior notice.
This report (“Report”) has been issued by Kalkine New Zealand Limited (FSP691351) (NZBN:9429047678101) (“Kalkine”). Kalkine is a Financial Advice Provider (“FAP”) and is authorised by a Class 1 Financial Advice Provider Licence issued by Financial Markets Authority (“FMA”) to provide financial advice. Kalkine provides only general financial advice through its research reports following a person becoming a member. The reports contain buy/sell/hold and other recommendations in relation to equity securities, managed funds and other managed investment schemes and other financial advice products. The recommendations and opinions in this Report and on Kalkine website do not take into account any of your investment objectives, financial situation or needs. Before you make a decision about whether to acquire a financial product, you should obtain the Product Disclosure Statement from the product issuer. You should consider the appropriateness of advice taking into account your own objectives, financial situation and needs and seek independent financial advice before making any financial decisions. If you act on the advice in the research reports, you may have to pay fees, expenses or other amounts (but not to Kalkine).
The information in this Report and on the Kalkine website has been prepared from a wide variety of sources, which Kalkine, to the best of its knowledge and belief, considers accurate. Kalkine has made every effort to ensure the reliability of the information contained in its reports (including this Report), newsletters and websites. All information represents our views at the date of publication and may change without notice.
Kalkine does not issue, sell or deal in any financial products. The information in this Report does not constitute an offer to sell securities or other financial products or a solicitation of an offer to buy securities or other financial products. Our reports contain general recommendations to invest in securities and other financial products. Kalkine is not responsible for, and does not guarantee, the performance of, or returns on, any investments mentioned in this Report.
This Report may contain information on past performance of particular investments. Past performance is not a reliable indicator of future performance. Returns stated do not take into account transaction costs and taxes.
Further information about the complaints and dispute resolution process, as well as information about Kalkine’s duties are available on Kalkine’s website. Please read our Financial Advice Provider (FAP) disclosure statement and Complaints Handling Guide, which are available on the website.
Copyright 2025 Krish Capital Pty. Ltd. (ABN 61629651510). All Rights Reserved. No part of this Report, or its content, may be reproduced in any form without our prior consent.
Past performance is not a reliable indicator of future performance.
 Please wait processing your request...