This report is an updated version of the report published on 21 May 2025 at 3:54 PM AEST.
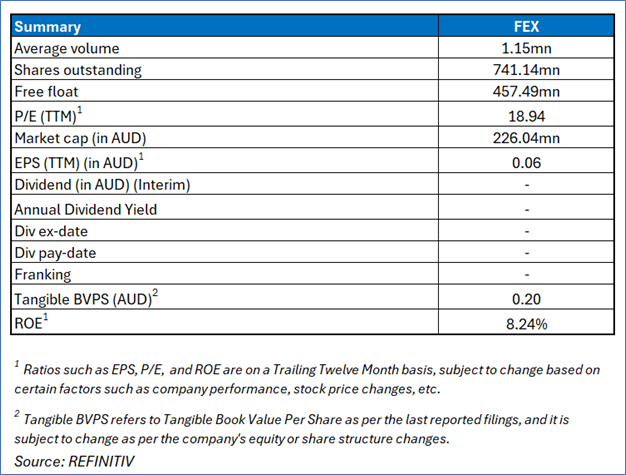
Fenix Resources Ltd (ASX: FEX)
Fenix Resources Ltd (ASX: FEX) is a fully integrated mining, logistics, and port services company based in the Mid-West region of Western Australia. The company operates a unique, vertically integrated business model that combines high-quality iron ore production with efficient logistics and port services. Fenix’s operations include the Iron Ridge mine, the Beebyn-W11 Deposit, the Twin Peaks Iron Ore Mine, and the Shine Iron Ore Mine, as well as its fully owned Newhaul Road and Port Logistics businesses.
Recommendation Rationale - SELL at AUD 0.310
- Surpassed Resistance: FEX is trading around the ‘Resistance 1’ level recommended on 16 April 2025. Therefore, FEX can face resistance at the current levels.
- Lapse of Fenix Takeover Offer: Fenix Resources' takeover offer for CZR Resources lapsed as it failed to meet the 75% acceptance threshold by the offer close date. Consequently, the bid became void, and Fenix canceled its proposed securities issue related to the acquisition. Fenix also ceased its substantial holding in CZR and decided not to match competing bids, effectively ending its pursuit of CZR’s Robe Mesa iron ore project.
- Elevated operating costs at Shine mine: Although production ramped up, the Shine mine experienced higher initial C1 cash costs (AU$86.90/wmt) in H1 FY25 due to early mine development and a higher strip ratio, which may pressure margins until operations stabilize.
- Decline in quarterly shipments:Total shipments dropped 23% quarter-on-quarter to 594kt in December 2024, which could reflect operational or market challenges impacting sales volumes
Daily Price Chart
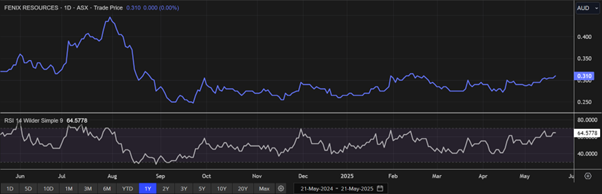
Daily Technical Chart, Data Source: REFINITIV
Valuation Methodology: Price/Cash Flow Approach (FY Jun'26E) (Illustrative)
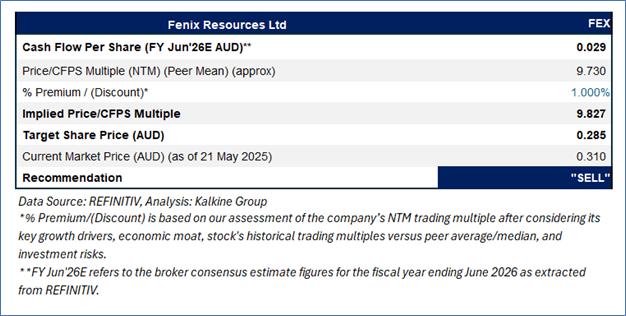
FEX is expected to trade at a slight premium to its peers considering the 61% and 3.18% increase in Ore Mined and Revenue Growth, respectively. For conducting valuation, the following peers have been considered: Evolution Mining Ltd (ASX: EVN), Genesis Minerals Ltd (ASX: GMD), and Pursuit Minerals Ltd (ASX: PUR).
Considering the rally in share price movement, current trading level, and risks associated, the share price can witness resistance at the current levels. Hence, a ‘Sell’ recommendation is given on the stock at the current market price of AUD 0.310, as of 21 May 2025, at 3:10 PM AEST.
Markets are trading in a highly volatile zone currently due to certain macro-economic issues and geopolitical issues prevailing geopolitical tensions. Therefore, it is prudent to follow a cautious approach while investing.
Note 1: Past performance is neither an indicator nor a guarantee of future performance.
Note 2: The reference date for all price data, currency, technical indicators, support, and resistance levels is 21 May 2025. The reference data in this report has been partly sourced from REFINITIV.
Note 3: Investment decisions should be made depending on an individual's appetite for upside potential, risks, holding duration, and any previous holdings. An 'Exit' from the stock can be considered if the Target Price mentioned as per the Valuation and or the technical levels provided has been achieved and is subject to the factors discussed above.
Note 4: Kalkine reports are prepared based on the stock prices captured either from REFINITIV or Trading View. Typically, REFINITIV or Trading View may reflect stock prices with a delay which could be a lag of 25-30 minutes. There can be no assurance that future results or events will be consistent with the information provided in the report. The information is subject to change without any prior notice.
Technical Indicators Defined: -
Support: A level at which the stock prices tend to find support if they are falling, and a downtrend may take a pause backed by demand or buying interest. Support 1 refers to the nearby support level for the stock and if the price breaches the level, then Support 7 May act as the crucial support level for the stock.
Resistance: A level at which the stock prices tend to find resistance when they are rising, and an uptrend may take a pause due to profit booking or selling interest. Resistance 1 refers to the nearby resistance level for the stock and if the price surpasses the level, then Resistance 7 May act as the crucial resistance level for the stock.
Stop-loss: It is a level to protect further losses in case of unfavourable movement in the stock prices.

 Please wait processing your request...