This report is an updated version of the report published on 18 September 2025 at 3:55 PM AEST.
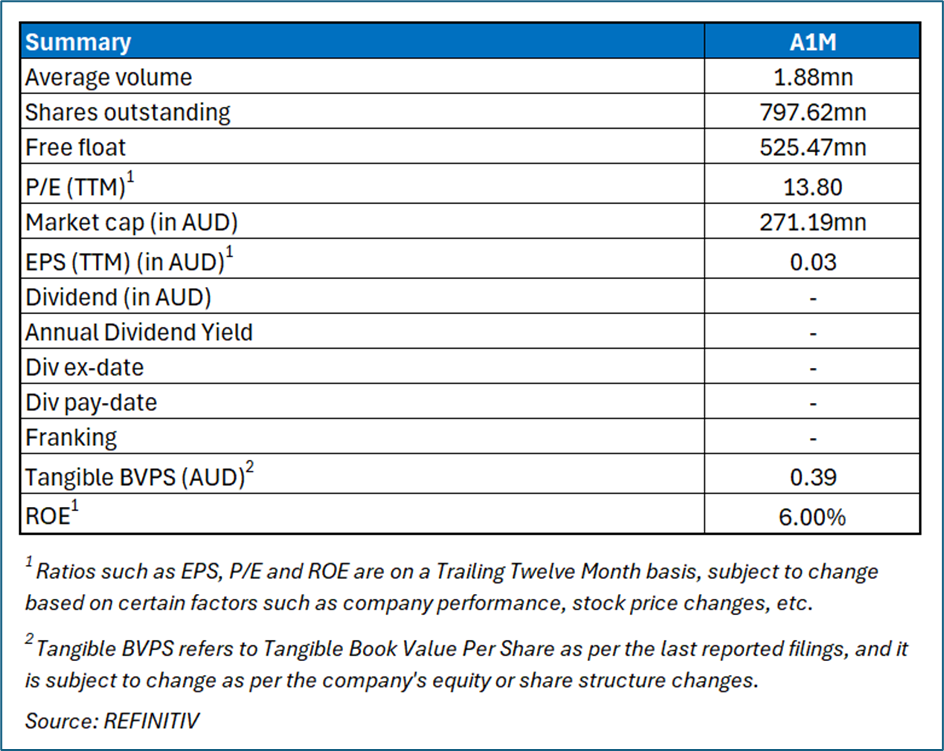
AIC Mines Ltd (ASX: A1M)
AIC Mines Ltd is an Australian resources company specializing in the exploration, development, and production of gold and copper assets within Australia. The company owns and operates the Eloise copper mine, a high-grade underground mine in North Queensland, producing copper concentrate with significant gold and silver by-products.
Recommendation Rationale – SELL at AUD 0.365
- Technical Standpoint: A1M’s share price has surpassed the R1 level recommended on 9 September August 2025. The approx. 14-day RSI is now around 64.57, moving towards overbought territory. This upward move raises the likelihood of short-term consolidation or downside retracement.
- Weaker Operating Cash Flow: Net cash inflow from operations declined slightly to AUD 50.9 million in FY25 from AUD 51.9 million in FY24, reflecting pressure on operating efficiency.
- Rising Non-Current Liabilities: Non-current liabilities increased significantly to AUD 55.257 million in FY25 from AUD 24.255 million in FY24, with interest-bearing debt rising to AUD 6.439 million from AUD 3.893 million, highlighting growing leverage and higher future repayment obligations.
- Overvalued Multiples: On a forward 12-month – key valuation multiples (EV/EBITDA, Price/Earnings, and Price/Cash Flow) are higher than average of the Basic Materials’ sector.
- Lower Ore Processing Volumes: Ore processed declined to 633,735 tonnes in FY25 from 687,691 tonnes in FY24, indicating reduced throughput and potential efficiency challenges.
A1M Daily Price Chart
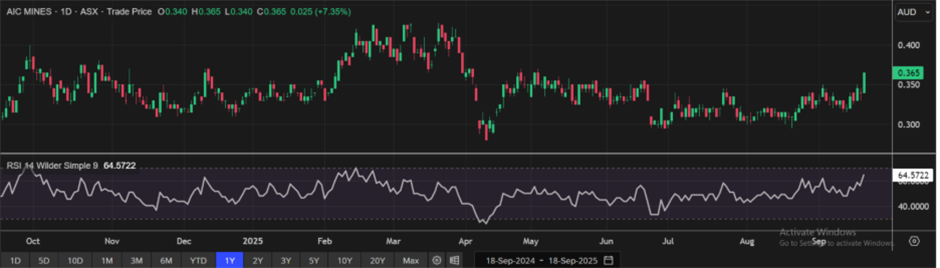
(Source: REFINITIV; Analysis by Kalkine Group)
Valuation Methodology: Price/Earning Approach (FY June'26E) (Illustrative)
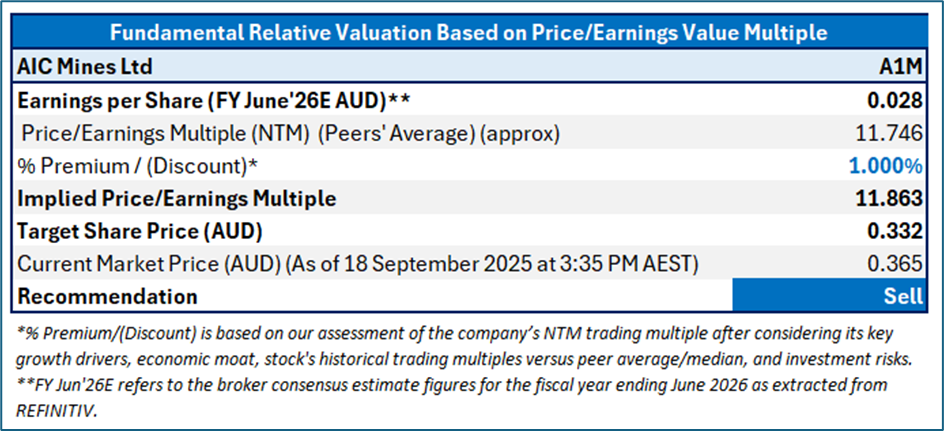
The stock might trade at a premium to peers given its 5% YoY increase in FY25 revenue to AUD 189.6 million versus FY24, a 22% uplift in EBITDA to AUD 63.2 million, and a 94% increase in profit after tax to AUD 14.9 million in FY25 from AUD 7.7 million in FY24. For conducting the valuation, peers Pantoro Gold Ltd (ASX: PNR), Aurelia Metals Ltd (ASX: AMI), and Perseus Mining Ltd (ASX: PRU) have been considered.
Given its current trading levels, recent rally in the share price, and risks associated, it is prudent to sell the stock at the current levels. Hence, a ‘Sell’ recommendation is given on the stock at the current market price of AUD 0.365, as of 18 September 2025 at 3:35 PM AEST.
Markets are trading in a highly volatile zone currently due to certain macro-economic issues and geopolitical issues prevailing geopolitical tensions. Therefore, it is prudent to follow a cautious approach while investing.
Note 1: Past performance is neither an indicator nor a guarantee of future performance.
Note 2: The reference date for all price data, currency, technical indicators, support, and resistance levels is 18 September 2025. The reference data in this report has been partly sourced from REFINITIV.
Note 3: Investment decisions should be made depending on an individual's appetite for upside potential, risks, holding duration, and any previous holdings. An 'Exit' from the stock can be considered if the Target Price mentioned as per the Valuation and or the technical levels provided has been achieved and is subject to the factors discussed above.
Note 4: Kalkine reports are prepared based on the stock prices captured either from REFINITIV or Trading View. Typically, REFINITIV or Trading View may reflect stock prices with a delay which could be a lag of 25-30 minutes. There can be no assurance that future results or events will be consistent with the information provided in the report. The information is subject to change without any prior notice.
Technical Indicators Defined: -
Support: A level at which the stock prices tend to find support if they are falling, and downtrend may take a pause backed by demand or buying interest.
Resistance: A level at which the stock prices tend to find resistance when they are rising, and uptrend may take a pause due to profit booking or selling interest.
Stop-loss: In general, it is a level to protect further losses in case of any unfavourable movement in the stock prices.
 Please wait processing your request...