This report is an updated version of the report published on 31 July 2025 at 11:37 AM AEST.
Airtasker Limited (ASX: ART)
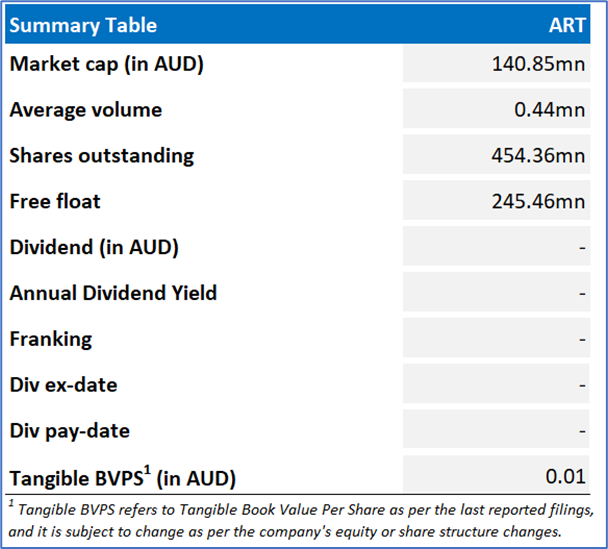
Airtasker Limited (ASX: ART) is an Australian online marketplace for local services. It connects people and businesses who need work done with people who want to work. In 2025, the company expanded its brand presence through a Formula One™ partnership with Visa Cash App Racing Bulls.
Recommendation Rationale – SELL at AUD 0.390
- Financial Performance: ART reported a negative Group EBITDA of AUD 7.2 million in 4QFY25, widening from a loss of AUD 2.7 million in the prior year. The increased EBITDA loss was primarily driven by an AUD 9.7 million investment in new marketplaces, including AUD 4.9 million in non-cash marketing spend tied to media advertising services with Channel 4 in the UK and TelevisaUnivision, iHeartMedia, Mercurius, and Sinclair in the US.
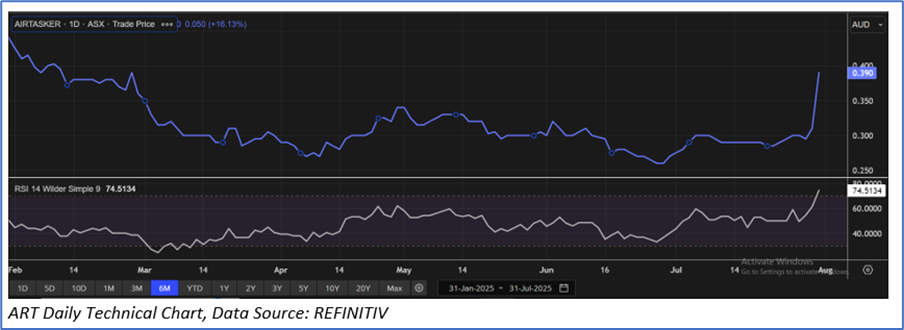
- Surpassed Resistance Level: ART's share price has surpassed its R2 level as recommended on July 11, 2025. Therefore, share price can face resistance at the current levels.
- Overvalued Multiples: On a forward 12-month basis - key valuation multiple (Price/Book) is higher than median of the Technology Sector.
- Technical Standpoint: The momentum oscillatory (14-day RSI is around 74.5 level), indicating overbought territory. This suggests the recent price recovery may be overextended, increasing the likelihood of near-term consolidation or a technical pullback.
- Emerging Risks: ART is exposed to several challenges, including its ongoing loss-making position, slower growth in Australia, currency and global expansion risks, platform dependence, and regulatory uncertainties.
ART Daily Chart
Valuation Methodology: EV/Sales Approach (FY June'26E) (Illustrative)
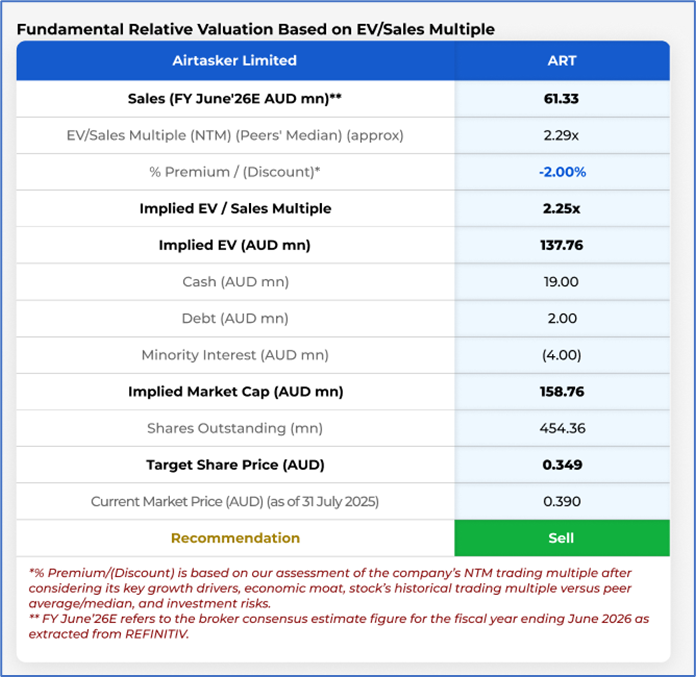
Stock might trade at a slight discount to its peers, considering group-level EBITDA loss, losses in new markets, resource allocation to brand awareness campaigns leading to high marketing expenses, accounting sensitivity to currency movements, and other related factors. Peers include Frontier Digital Ventures Ltd (ASX: FDV), Hipages Group Holdings Ltd (ASX: HPG), Domain Holdings Australia Ltd (ASX: DHG) and others
Considering that the stock has surpassed its R2 level, macroeconomic uncertainty, share price movement, current trading level, and risks associated, the share price can face consolidation at the current levels. Hence, a ‘Sell’ recommendation is given on the stock at the current market price of AUD 0.390, at 10:55 AM AEST, as of 31 July 2025.
Note: This report may be updated with details around fundamental and technical analysis, price/ chart in due course, as appropriate.
Note 1: Past performance is neither an indicator nor a guarantee of future performance.
Note 2: The reference date for all price data, currency, technical indicators, support, and resistance levels is 31 July 2025. The reference data in this report has been partly sourced from REFINITIV.
Note 3: Investment decisions should be made depending on an individual's appetite for upside potential, risks, holding duration, and any previous holdings. An 'Exit' from the stock can be considered if the Target Price mentioned as per the Valuation and or the technical levels provided has been achieved and is subject to the factors discussed above.
Note 4: Kalkine reports are prepared based on the stock prices captured either from REFINITIV or Trading View. Typically, REFINITIV or Trading View may reflect stock prices with a delay which could be a lag of 25-30 minutes. There can be no assurance that future results or events will be consistent with the information provided in the report. The information is subject to change without any prior notice.
Technical Indicators Defined: -
Support: A level at which the stock prices tend to find support if they are falling, and a downtrend may take a pause backed by demand or buying interest. Support 1 refers to the nearby support level for the stock and if the price breaches the level, then Support 2 may act as the crucial support level for the stock.
Resistance: A level at which the stock prices tend to find resistance when they are rising, and an uptrend may take a pause due to profit booking or selling interest. Resistance 1 refers to the nearby resistance level for the stock and if the price surpasses the level, then Resistance 2 may act as the crucial resistance level for the stock.
Stop-loss: It is a level to protect further losses in case of unfavourable movement in the stock prices.

 Please wait processing your request...