This report is an updated version of the report published on 13 November 2025 at 12:24 PM AEDT
Wildcat Resources Limited (ASX: WC8)
Wildcat Resources Limited is an Australian mineral explorer dedicated to identifying and developing lithium and gold projects in Western Australia’s Pilbara region. Its projects include the Tabba Tabba Lithium-Tantalum Project, Bolt Cutter Lithium and Gold Projects, and the Mt Adrah Gold Project.
Recommendation Rationale – SELL at AUD 0.260
- Technical Standpoint: WC8’s share price has surpassed the R2 level of AUD 0.251 recommended on 19 September 2025. The 14-day RSI is now around 64.99, moving towards overbought territory. This upward move raises the risk of short-term consolidation or downside retracement.
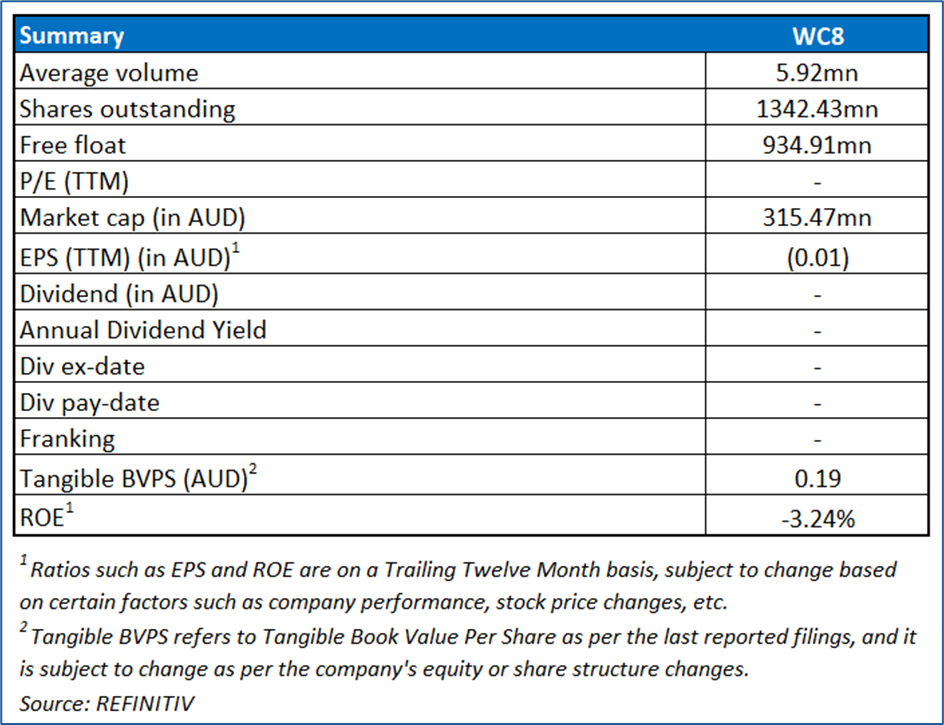
- Elevated Expenditure: In FY25, WC8 reported total expenditure of AUD 12.7 million versus AUD 11.3 million in FY24. The increase highlights sustained cost intensity with limited progress in managing operating spend.
- Ongoing Operating Losses: WC8 posted a net loss from continuing operations of AUD 8.2 million in FY25 compared with AUD 8.9 million in FY24. Despite the top line improvement, losses remain significant and indicate slow movement toward profitability.
- Overvalued Multiples: On a forward 12-month basis – key trading multiple (EV/Sales) is higher than industry (Metals & Mining) average, hence looks overvalued.
- Commodity Price Volatility: The company’s valuation is tied to lithium and gold prices. Sharp downturns in commodity markets can reduce project economics, investor sentiment, and access to capital.
WC8 Daily Chart
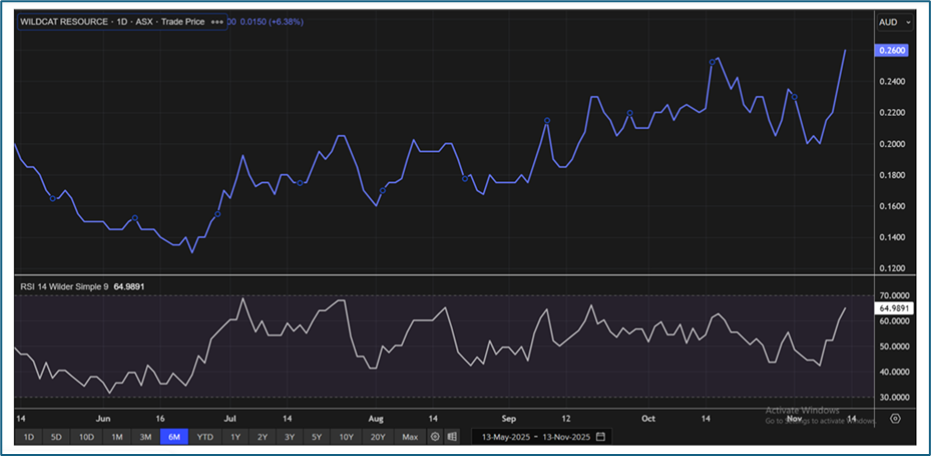
WC8 Daily Technical Chart, Data Source: REFINITIV
Valuation Methodology: Price/Book Value Approach (FY June'26E) (Illustrative)
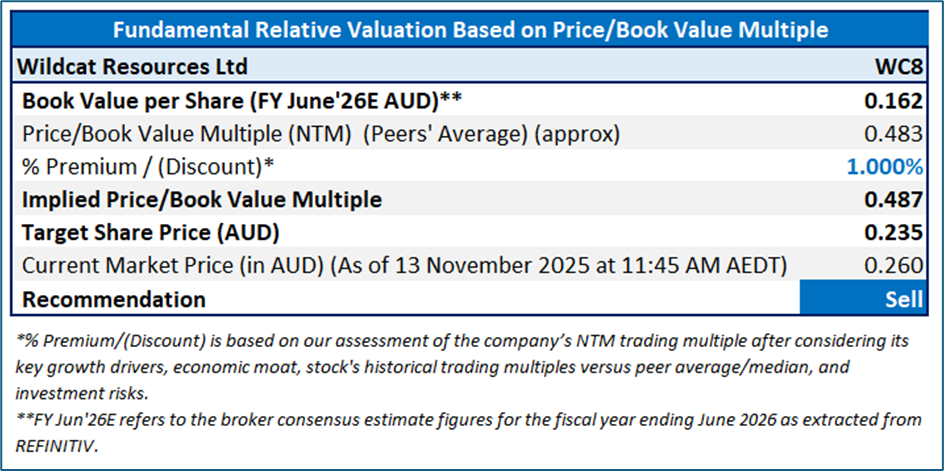
The stock might trade at a slight premium to its peers considering the jump in total income to AUD 1.53 million in FY25 from AUD 2.12 thousand in FY24 and the reduction in total liabilities to AUD 4.45 million as of 30 June 2025 from AUD 11.01 million as of 30 June 2024.
For conducting the valuation, peers including Vulcan Steel Ltd (ASX: VSL), Prairie Lithium Ltd (ASX: PL9), Burgundy Diamond Mines Ltd (ASX: BDM) have been considered.
Considering that the stock has surpassed its R2 level, macroeconomic uncertainty, share price movement, current trading level, and risks associated, the share price can face consolidation at the current levels. Hence, a ‘Sell’ recommendation is given on the stock at the current market price of AUD 0.260, at 11:45 AM AEDT, as of 13 November 2025.
Markets are trading in a highly volatile zone currently due to certain macro-economic issues and geopolitical issues prevailing geopolitical tensions. Therefore, it is prudent to follow a cautious approach while investing.
Note 1: Past performance is neither an indicator nor a guarantee of future performance.
Note 2: The reference date for all price data, currency, technical indicators, support, and resistance levels is 13 November 2025. The reference data in this report has been partly sourced from REFINITIV.
Note 3: Investment decisions should be made depending on an individual's appetite for upside potential, risks, holding duration, and any previous holdings. An 'Exit' from the stock can be considered if the Target Price mentioned as per the Valuation and or the technical levels provided has been achieved and is subject to the factors discussed above.
Note 4: Kalkine reports are prepared based on the stock prices captured either from REFINITIV or Trading View. Typically, REFINITIV or Trading View may reflect stock prices with a delay which could be a lag of 25-30 minutes. There can be no assurance that future results or events will be consistent with the information provided in the report. The information is subject to change without any prior notice.
Technical Indicators Defined: -
Support: A level at which the stock prices tend to find support if they are falling, and downtrend may take a pause backed by demand or buying interest.
Resistance: A level at which the stock prices tend to find resistance when they are rising, and uptrend may take a pause due to profit booking or selling interest.
Stop-loss: In general, it is a level to protect further losses in case of any unfavourable movement in the stock prices

 Please wait processing your request...