This report is an updated version of the report published on 19 September 2025 at 11:36 AM AEST.
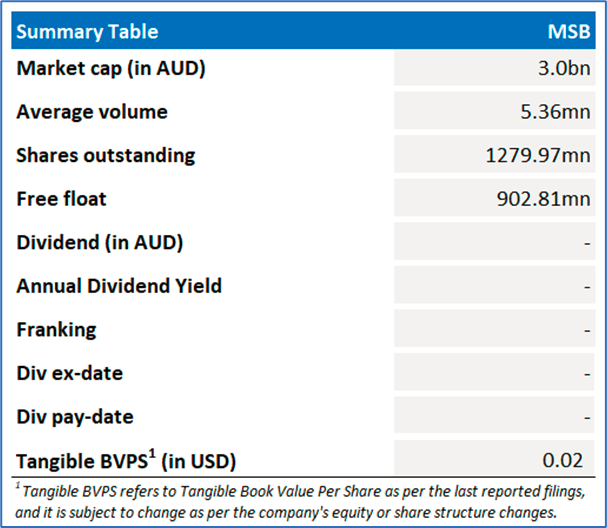
Mesoblast Limited (ASX: MSB)
Mesoblast Limited is engaged in developing allogeneic (off-the-shelf) cellular medicines for the treatment of severe and life-threatening inflammatory conditions. Using its proprietary mesenchymal lineage cell therapy technology platform, the company has established a broad portfolio of late-stage product candidates. The company is also listed on NASDAQ (MESO).
Recommendation Rationale – SELL at AUD 2.47
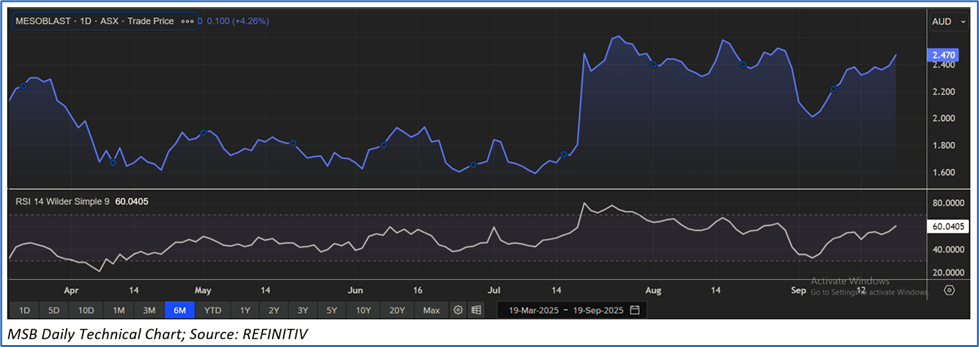
- Trading Around Resistance: The stock has crossed its first resistance (R1) of AUD 2.431. Its 14-day RSI is showing a reading of ~60.04, suggesting the stock is approaching overbought zone; hence, it may face some consolidation before scaling further upside.
- Overvalued Multiples: On a forward 12-month basis - key valuation multiples (EV/Sales and EV/EBITDA) are higher than the median of Biotechnology & Medical Research industry.
- Increased losses: In FY25, MSB's total revenue increased by 191% YoY to USD 17.2mn. Despite the increase in revenue its net losses during the reporting period increased to USD 101.8mn vs USD 88.1mn in FY24. The increase in losses in FY25 was because of higher Selling, General & Admin expenses, which stood at USD 39.3mn for FY2025, up USD 14.3mn on FY2024.
- Clinical Development & Regulatory Risks: MSB's therapies are based on mesenchymal stem/stromal cell (MSC) technology, a novel platform with relatively few precedents. Predicting development time, costs, or outcomes is difficult. Secondly, there is no guarantee the company will demonstrate safety and efficacy to the satisfaction of regulatory authorities (e.g. FDA, EMA). Even after successful trials, regulators might ask for more data.
MSB Daily Chart
Valuation Methodology: EV/Sales Approach (FY Jun'26E) (Illustrative)
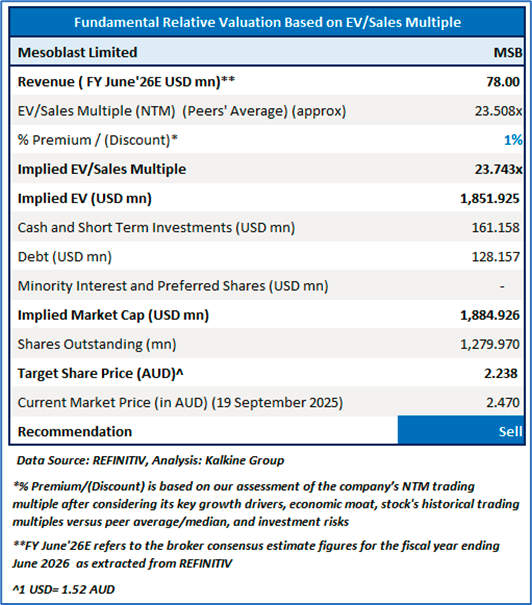
The stock might trade at a slight premium to its peers, considering the YoY revenue growth in FY25, manufacturing services agreement with Lonza, partnership with JCR Pharmaceuticals, new product pipeline, and debt repayment in FY25.
For conducting valuation, the following peers have been considered: PYC Therapeutics Ltd (ASX: PYC), Orthocell Ltd (ASX: OCC), Immutep Ltd (ASX: IMM) and others.
Considering the rally in share price movement, current trading level, and risks associated, the share price can witness consolidation at the current levels. Hence, a ‘Sell’ recommendation is given on the stock at the current market price of AUD 2.47, as of 19 September 2025 at 10:45 AM AEST.
Markets are trading in a highly volatile zone currently due to certain macro-economic issues and geopolitical issues prevailing geopolitical tensions. Therefore, it is prudent to follow a cautious approach while investing.
Note 1: Past performance is neither an indicator nor a guarantee of future performance.
Note 2: The reference date for all price data, currency, technical indicators, support, and resistance levels is 19 September 2025. The reference data in this report has been partly sourced from REFINITIV.
Note 3: Investment decisions should be made depending on an individual's appetite for upside potential, risks, holding duration, and any previous holdings. An 'Exit' from the stock can be considered if the Target Price mentioned as per the Valuation and or the technical levels provided has been achieved and is subject to the factors discussed above.
Note 4: Kalkine reports are prepared based on the stock prices captured either from REFINITIV or Trading View. Typically, REFINITIV or Trading View may reflect stock prices with a delay which could be a lag of 25-30 minutes. There can be no assurance that future results or events will be consistent with the information provided in the report. The information is subject to change without any prior notice.
Technical Indicators Defined: -
Support: A level at which the stock prices tend to find support if they are falling, and a downtrend may take a pause backed by demand or buying interest. Support 1 refers to the nearby support level for the stock and if the price breaches the level, then Support 2 may act as the crucial support level for the stock.
Resistance: A level at which the stock prices tend to find resistance when they are rising, and an uptrend may take a pause due to profit booking or selling interest. Resistance 1 refers to the nearby resistance level for the stock and if the price surpasses the level, then Resistance 2 may act as the crucial resistance level for the stock.
Stop-loss: It is a level to protect further losses in case of unfavourable movement in the stock prices.

 Please wait processing your request...