This report is an updated version of the report published on 20 October 2025 at 3:18 PM AEDT.
Compumedics Limited (ASX:CMP)
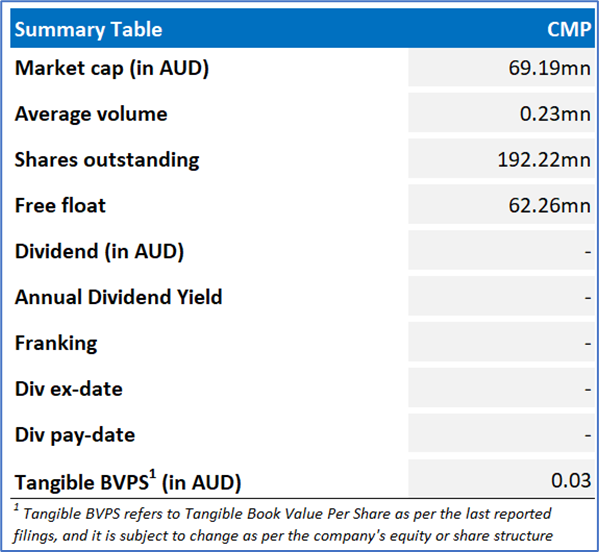
Compumedics Limited (ASX:CMP) is a global medical device company specialising in sleep, brain, and blood flow diagnostics. The company owns Neuroscan (USA) and DWL (Germany), with operations across the Americas, APAC, Europe, and the Middle East. Founded in 1987, CMP is a recognised innovator in clinical and home monitoring technologies.
Recommendation Rationale – SELL at AUD 0.400
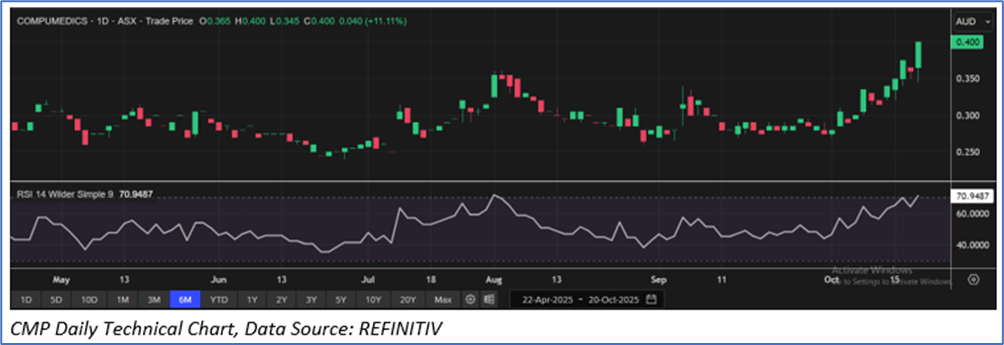
- Technical Standpoint: CMP’s share price has surpassed its R2 level, recommended on 24 September 2025. Also, the momentum oscillatory (14-day RSI is around 70.9 level), indicating an overbought zone. This shows increasing the likelihood of near-term consolidation or technical pullback.
- Overvalued Multiples: On a forward 12-month basis - key valuation multiples (EV/EBITDA, and Price/Earnings) are higher than median of the Healthcare Sector.
- Increase in Net Loss: In FY25, the company reported a net loss of AUD 1.27 million, widening from a loss of AUD 0.34 million in the previous year. The increase was driven by higher finance costs, elevated R&D spending, and increased administrative expenses. Ongoing financial losses pose risks by straining resources, constraining growth opportunities, and potentially necessitating additional funding or capital raising to support operations.
- Emerging Risks: Any delays or underperformance in the launch of new products, such as Somfit D or MEG systems, could constrain revenue growth and diminish returns on recent R&D investments. Operating in highly regulated markets, the company may also face regulatory delays or compliance issues that could affect product approvals, market access, or the ongoing revenue from existing platforms.
CMP Daily Chart
Valuation Methodology: EV/Sales Relative Valuation Approach (FY June'26E) (Illustrative)
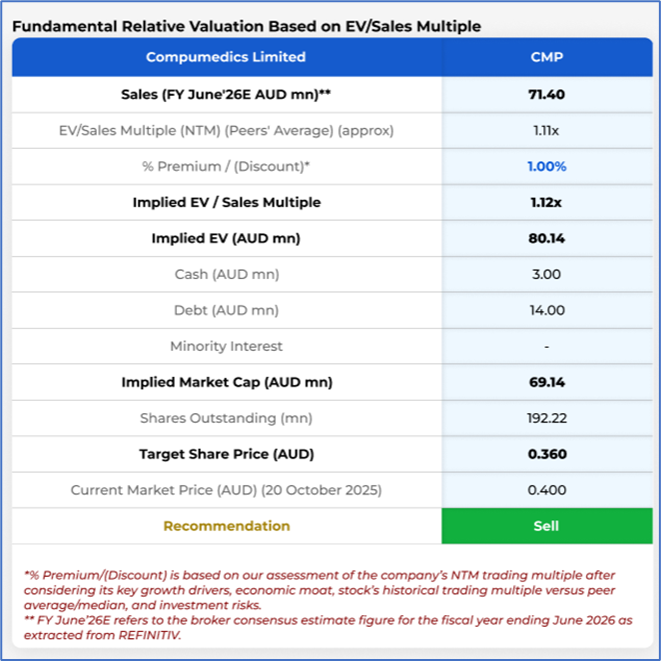
Stock might trade at a slight premium to its peers, considering projected revenue of AUD 70mn and EBITDA of AUD 9mn for FY26, recent FDA clearance, global reach with Somfit®D cleared in Australia, New Zealand, the EU and the US, and other factors. For the valuation purpose, peers include Universal Biosensors Inc (ASX: UBI), Nova Eye Medical Ltd (ASX: EYE), Somnomed Ltd (ASX: SOM), and others.
Considering that the stock has surpassed its R2 level, macroeconomic uncertainty, share price movement, current trading level, and risks associated, the share price can face consolidation at the current levels. Hence, a ‘Sell’ recommendation is given on the stock at the current market price of AUD 0.400, at 2:35 PM AEDT, as of 20 October 2025.
Note: This report may be updated with details around fundamental and technical analysis, price/ chart in due course, as appropriate.
Note 1: Past performance is neither an indicator nor a guarantee of future performance.
Note 2: The reference date for all price data, currency, technical indicators, support, and resistance levels is 20 October 2025. The reference data in this report has been partly sourced from REFINITIV.
Note 3: Investment decisions should be made depending on an individual's appetite for upside potential, risks, holding duration, and any previous holdings. An 'Exit' from the stock can be considered if the Target Price mentioned as per the Valuation and or the technical levels provided has been achieved and is subject to the factors discussed above.
Note 4: Kalkine reports are prepared based on the stock prices captured either from REFINITIV or Trading View. Typically, REFINITIV or Trading View may reflect stock prices with a delay which could be a lag of 25-30 minutes. There can be no assurance that future results or events will be consistent with the information provided in the report. The information is subject to change without any prior notice.
Technical Indicators Defined: -
Support: A level at which the stock prices tend to find support if they are falling, and a downtrend may take a pause backed by demand or buying interest. Support 1 refers to the nearby support level for the stock and if the price breaches the level, then Support 2 may act as the crucial support level for the stock.
Resistance: A level at which the stock prices tend to find resistance when they are rising, and an uptrend may take a pause due to profit booking or selling interest. Resistance 1 refers to the nearby resistance level for the stock and if the price surpasses the level, then Resistance 2 may act as the crucial resistance level for the stock.
Stop-loss: It is a level to protect further losses in case of unfavourable movement in the stock prices.

 Please wait processing your request...