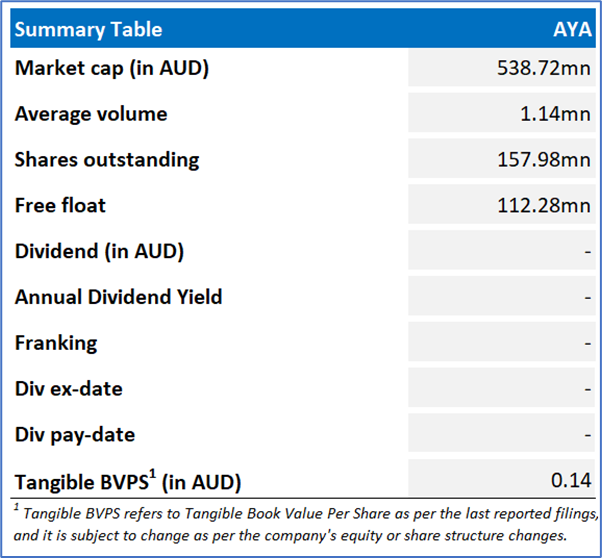
Artrya Limited (ASX: AYA)
Artrya Limited (ASX: AYA) is an Australian medical-technology firm developing AI-powered software to detect, diagnose and manage coronary artery disease. Its flagship product, “Salix”, uses deep learning to analyse coronary CT angiography scans, helping physicians identify plaque, assess risk and streamline workflow.
Recommendation Rationale – SELL at AUD 3.25
- Surpassed Resistance Level: AYA’s share price has surpassed its R2 level, recommended on 24 July 2025. Therefore, share price can face resistance at the current levels.
- Technical Commentary: While undergoing a prolong uptrend, AYA’s stock price formed a Bearish Evening Star candlestick pattern, anticipating a potential correction. Additionally, the momentum oscillator RSI (14-period) is moving south from the overbought region, providing more support to the previous observation. Price is trading between its previous peak and trough, which could serve as resistance and support levels for the stock, respectively. A major support level is identified at AUD 2.970, while a critical resistance level is positioned at AUD 3.530.
- Increase in Losses: For the financial year ended 30 June 2025, the Group reported a net loss of AUD 16.4 million, compared to a loss of AUD 14.0 million in the previous year, reflecting higher expenses associated with ongoing business development and operational activities.
- Emerging Risks: AYA faces key risks including potential delays in regulatory approvals, reliance on successful market penetration in the U.S., and competition from established medical technology companies. These factors could impact the company’s growth and commercial success.
AYA Daily Chart
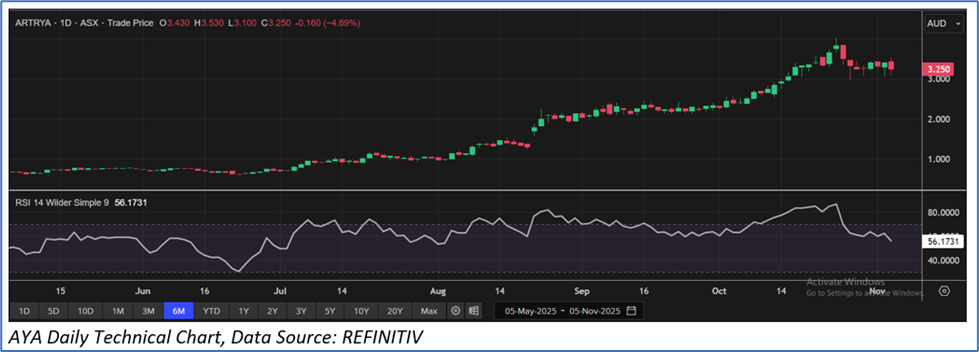
Considering that the stock has surpassed its R2 level, macroeconomic uncertainty, share price movement, current trading level, and risks associated, the share price can face consolidation at the current levels. Hence, a ‘Sell’ recommendation is given on the stock at the closing market price of AUD 3.250, down ~4.69% as of 5 November 2025.
Note: This report may be updated with details around fundamental and technical analysis, price/ chart in due course, as appropriate.
Note 1: Past performance is neither an indicator nor a guarantee of future performance.
Note 2: The reference date for all price data, currency, technical indicators, support, and resistance levels is 5 November 2025. The reference data in this report has been partly sourced from REFINITIV.
Note 3: Investment decisions should be made depending on an individual's appetite for upside potential, risks, holding duration, and any previous holdings. An 'Exit' from the stock can be considered if the Target Price mentioned as per the Valuation and or the technical levels provided has been achieved and is subject to the factors discussed above.
Note 4: Kalkine reports are prepared based on the stock prices captured either from REFINITIV or Trading View. Typically, REFINITIV or Trading View may reflect stock prices with a delay which could be a lag of 25-30 minutes. There can be no assurance that future results or events will be consistent with the information provided in the report. The information is subject to change without any prior notice.
Technical Indicators Defined: -
Support: A level at which the stock prices tend to find support if they are falling, and a downtrend may take a pause backed by demand or buying interest. Support 1 refers to the nearby support level for the stock and if the price breaches the level, then Support 2 may act as the crucial support level for the stock.
Resistance: A level at which the stock prices tend to find resistance when they are rising, and an uptrend may take a pause due to profit booking or selling interest. Resistance 1 refers to the nearby resistance level for the stock and if the price surpasses the level, then Resistance 2 may act as the crucial resistance level for the stock.
Stop-loss: It is a level to protect further losses in case of unfavourable movement in the stock prices.

 Please wait processing your request...