This report is an updated version of the report published on 21 May 2025 at 12:50 PM AEST.
Perseus Mining Ltd (ASX: PRU)
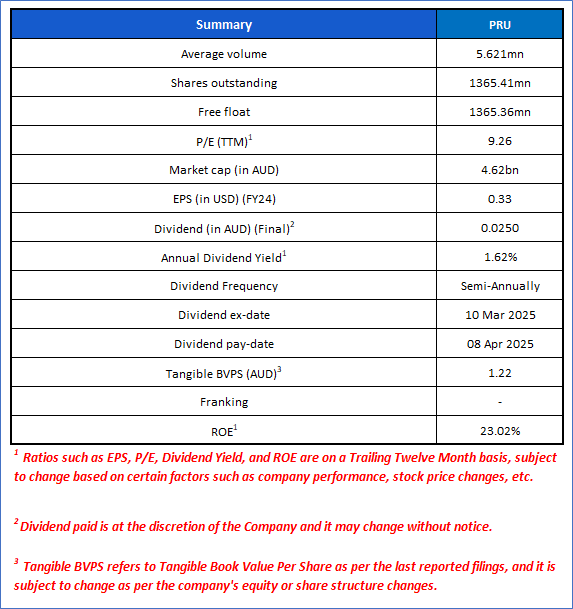
Perseus Mining Ltd (ASX: PRU) is a West African-focused gold production, development, and exploration company headquartered in Perth, Australia. The company operates three gold mines: Edikan Gold Mine in Ghana, and Sissingué and Yaouré Gold Mines in Côte d’Ivoire. These operations collectively enable Perseus to produce over 500,000 ounces of gold annually, positioning it as a mid-tier gold producer.
Recommendation Rationale - SELL at AUD 3.670
- Surpassed Resistance: PRU has surpassed the ‘Resistance 2’ level recommended on 14 May 2025. Therefore, PRU can face resistance at the current levels.
- Overvalued Multiples: On a forward 12-month basis – key trading multiples (Price/Earnings, Price/Cash Flow, Price/Book, and EV/Sales) are higher than median of the Basic Materials’ sector.
- Rising Production Costs: The all-in site cost (AISC) remained relatively high at about US$1,209 per ounce in March 2025 quarter, increased from US$1,127 in December 2024 quarter. Elevated costs can pressure margins if gold prices fluctuate downward.
- Exposure to West African Geopolitical Risks: Perseus continued to operate primarily in West Africa, where political and regulatory risks remain, potentially affecting future operations and project developments.
Daily Price Chart
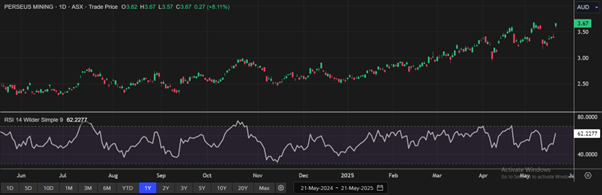
Daily Technical Chart, Data Source: REFINITIV
Valuation Methodology: Price/Cash Flow Approach (FY Jun'26E) (Illustrative)
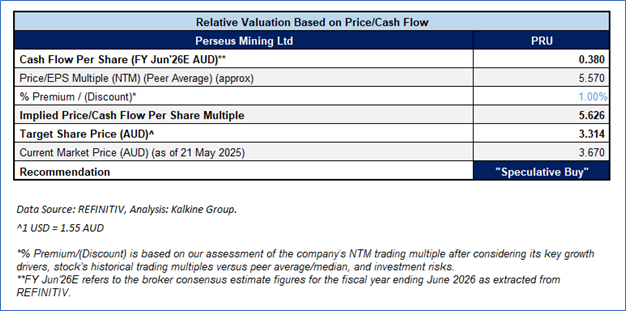
PRU is expected to trade at a slight premium to its peers considering the 19% and 22% increase in Revenue and Profit after Tax, respectively. For conducting valuation, the following peers have been considered: Northern Star Resources Ltd (ASX: NST), Vault Minerals Ltd (ASX: VAU), and St Barbara Ltd (ASX: SBM).
Considering the rally in share price movement, current trading level, and risks associated, the share price can witness resistance at the current levels. Hence, a ‘Sell’ recommendation is given on the stock at the current market price of AUD 3.670, as of 21 May 2025, at 12:05 PM AEST.
Markets are trading in a highly volatile zone currently due to certain macro-economic issues and geopolitical issues prevailing geopolitical tensions. Therefore, it is prudent to follow a cautious approach while investing.
Note 1: Past performance is neither an indicator nor a guarantee of future performance.
Note 2: The reference date for all price data, currency, technical indicators, support, and resistance levels is 21 May 2025. The reference data in this report has been partly sourced from REFINITIV.
Note 3: Investment decisions should be made depending on an individual's appetite for upside potential, risks, holding duration, and any previous holdings. An 'Exit' from the stock can be considered if the Target Price mentioned as per the Valuation and or the technical levels provided has been achieved and is subject to the factors discussed above.
Note 4: Kalkine reports are prepared based on the stock prices captured either from REFINITIV or Trading View. Typically, REFINITIV or Trading View may reflect stock prices with a delay which could be a lag of 25-30 minutes. There can be no assurance that future results or events will be consistent with the information provided in the report. The information is subject to change without any prior notice.
Note 5: Dividend Yield may vary as per the stock price movement.
Technical Indicators Defined: -
Support: A level at which the stock prices tend to find support if they are falling, and a downtrend may take a pause backed by demand or buying interest. Support 1 refers to the nearby support level for the stock and if the price breaches the level, then Support 7 May act as the crucial support level for the stock.
Resistance: A level at which the stock prices tend to find resistance when they are rising, and an uptrend may take a pause due to profit booking or selling interest. Resistance 1 refers to the nearby resistance level for the stock and if the price surpasses the level, then Resistance 7 May act as the crucial resistance level for the stock.
Stop-loss: It is a level to protect further losses in case of unfavourable movement in the stock prices.

 Please wait processing your request...