This report is an updated version of the report published on 18 February 2025 at 3.38 PM AEDT.
HMC Capital Limited (ASX: HMC):
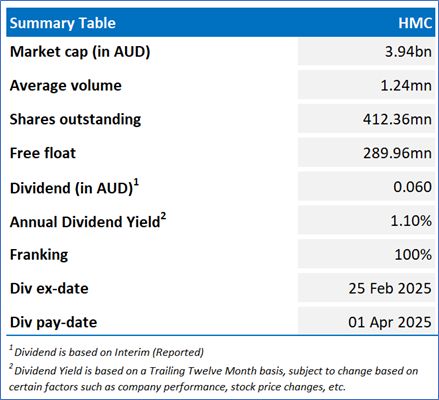
HMC is an ASX-listed diversified alternative asset manager specialising in high conviction and scalable real asset strategies on behalf of individuals, large institutions, and super funds.
Recommendation Rationale – SELL at AUD 11.39
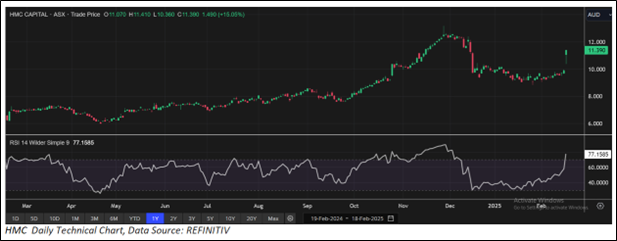
- Financial Highlights: The company’s total expenses increased by 123.40% YoY to AUD 115.5mn in 1HFY25 vs AUD 51.7mn in 1HFY24. Cash and cash equivalents declined by 58.20% to AUD 78.0mn as of 31 December 2024 vs AUD 186.6mn as of 30 June 2024. Total liabilities increased by 40.07% to AUD 393.6mn as of 31 December 2024 vs AUD 281.0mn as of 30 June 2024. Trading Near the Resistance: HMC stock has surpassed its R1 level recommended on 13 February 2025. Therefore, share price can face resistance at the current levels.
- Overvalued Multiples: On a forward 12-month basis – key trading multiples (EV/Sales, EV/EBITDA, Price/Earnings, Price/Cash flow, Price/Book) are higher than the median of Energy sector.
- Market Risk: Fluctuations in market conditions can significantly impact asset values and investment returns, making it crucial for investors to closely monitor and adapt to these changes. Additionally, risks associated with the management and operation of an investment portfolio can arise, such as ineffective strategy execution, poor asset allocation, or unexpected market shifts.
HMC’s Daily Price Chart
Valuation Methodology: Price/Book Approach (FY June'25E) (Illustrative)
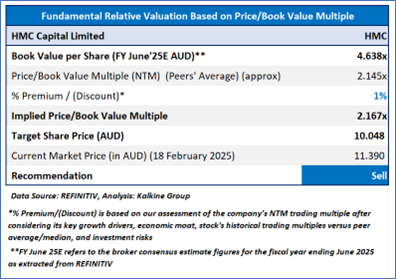
Stock might trade at a slight premium to its peers considering the revenue growth in 1HFY25, increased net income in 1HFY25, expected operating eps growth in FY25, forecasted DPS for FY25, and cost management. For conducting the valuation, the following peers have been considered: EQT Holdings Ltd (ASX: EQT), Platinum Asset Management Ltd (ASX: PTM), and AUB Group Ltd (ASX: AUB) have been considered.
Considering that the stock has crossed its R1 level, rally in share price movement, current trading level, and risks associated, the share price can witness resistance at the current levels. Hence, a ‘Sell’ recommendation is given on the stock at the current market price of AUD 11.39, as of 18 February 2025, at 1:35 PM AEDT.
Markets are trading in a highly volatile zone currently due to certain macro-economic issues and geopolitical issues prevailing geopolitical tensions. Therefore, it is prudent to follow a cautious approach while investing.
Note 1: Past performance is neither an indicator nor a guarantee of future performance.
Note 2: The reference date for all price data, currency, technical indicators, support, and resistance levels is 18 January 2025. The reference data in this report has been partly sourced from REFINITIV.
Note 3: Investment decisions should be made depending on an individual's appetite for upside potential, risks, holding duration, and any previous holdings. An 'Exit' from the stock can be considered if the Target Price mentioned as per the Valuation and or the technical levels provided has been achieved and is subject to the factors discussed above.
Note 4: Dividend Yield may vary as per the stock price movement.
Note 5: Kalkine reports are prepared based on the stock prices captured either from REFINITIV or Trading View. Typically, REFINITIV or Trading View may reflect stock prices with a delay which could be a lag of 25-30 minutes. There can be no assurance that future results or events will be consistent with the information provided in the report. The information is subject to change without any prior notice.
Technical Indicators Defined: -
Support: A level at which the stock prices tend to find support if they are falling, and downtrend may take a pause backed by demand or buying interest.
Resistance: A level at which the stock prices tend to find resistance when they are rising, and uptrend may take a pause due to profit booking or selling interest.
Stop-loss: In general, it is a level to protect further losses in case of any unfavourable movement in the stock prices.

 Please wait processing your request...